Task 0. Viewing file in a notebook
To get started, go to the View section of the starter kit and try to run the code in that section.
from PIL import Image
img = Image.open('eye.png')
img = img.convert("L") # grayscale
img # same as display(img)
It should display the eyeballs like this:
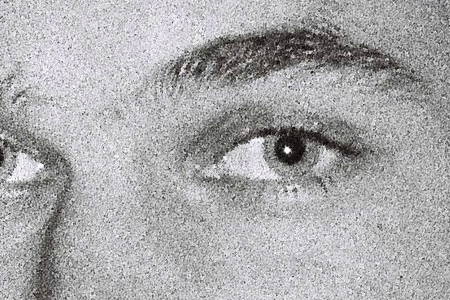
That code shows you how to open an image file, convert it to grayscale, and display the image by simply referencing the img variable. That is shorthand for explicitly telling the notebook to display that object: display(img).
If you do img.show(), than a separate window will pop up instead of showing it in line in the notebook.
Task 1. Flipping an image horizontally
As a first task, create a function, flip, and a code snippet that calls that function under the Flip section of the starter kit that shows eyeballs image, eye.png, flipped horizontally. Here are the before and after shots for your reference:
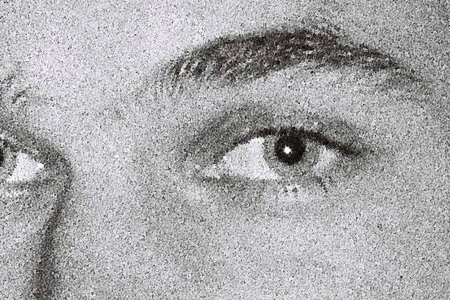
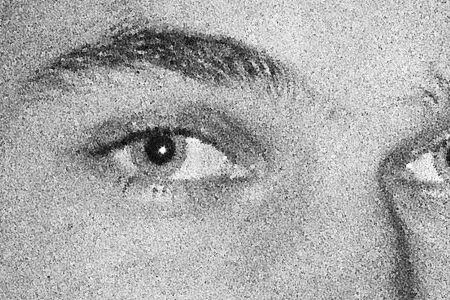
Let's look at the functionality we need to create the flip function, since you just learned how to open and display an image.
Three new image library pieces
To write your flip function, you will need three basic pieces:
● img.size returns a tuple containing the width and height of image img so you can write code like this:
● width, height = img.size
● You'll need the width and height to iterate over the pixels of the image.
● img.copy() duplicates image img. For our flip function, it would be hard to modify the image in place because we would be overwriting pixels we would need to flip later. It's easier to create a copy of the image in flipped position. You can write code like this: imgdup = img.copy()
● img.load() is yet another weird name from PIL that actually returns an object that looks like a two-dimensional matrix, which is really just a list of lists such as m = [[1,2], [3, 4]]. When printed, the output looks like a matrix:
● m = [[1, 2],
[3, 4]]
● To get element 3, we would use list index expression m[1][0] because we want the list at index 1, m[1], and then element 0 within that list. The two-dimensional object returned by load() uses similar notation. If we ask for the "matrix" with:
● m = img.load()
● then we use notation m[x,y] to get the pixel at position (x, y). As is usual with Cartesian coordinates, the xindex is the horizontal index.
You will use these functions for the remaining tasks so keep them in mind.
Iterating over the image matrix
Define function flip using the familiar function definition syntax and have it take a parameter called img, which will be the image we want to flip. The goal is to create a copy of this image, flip it, and return a copy so that we do not alter the incoming original image. To create flip, write code that implements the following steps.
1. Use size to define local variables width and height
2. Use copy() to make a copy of the incoming image img and save it in a local variable
3. Use load() to get the two-dimensional pixel matrix out of the incoming image and the copy of the image. Store these results in two new local variables.
4. To walk over the two-dimensional image, we've learned we need every combination of x and y. That means we need a nested for loop. Create a nested for loop that iterates over all x and all y values within the width and height of the image.
5. Within the inner loop, set pixels in the image copy to the appropriate pixel copied from the original image
6. At the end of the function, return the flipped image
The only remaining issue is determining which pixel from the original image to copy into the (x, y) position in the image copy. The y index will be the same since we are flipping horizontally. The x index in the flipped image is index width-x-1 from the original image. Trying out a few sample indexes shows that this works well. For example, a flipped image with width=10 has its pixel at x=0 pulled from index x=10-0-1=9 in the original image. That's great, because it takes the image from all in the right in the original and copies it to the far left of the copy. Checking the opposite extreme, x=9 in the flipped image should be x=10-9-1=0 from the original image.
What to do when the program doesn't work
If you have problems, follow these steps:
1. Don't Panic! Relax and realize that you will solve this problem, even if it takes a little bit of messing around. Banging your head against the computer is part of your job. Remember that the computer is doing precisely what you tell it to do. There is no mystery.
2. Determine precisely what is going on. Did you get an error message from Python? Is it a syntax error? If so, review the syntax of all your statements and expressions. If you got an error message that has what we call a stack trace, a number of things could be wrong. For example, if I misspell `open()` as `opem()`, I get the following message:
3. —————————————————————————
AttributeError Traceback (most recent call last)
<ipython-input-39-86d19b3216b2> in <module>()
1 from PIL import Image
2
—-> 3 img = Image.opem('eye.png')
4 img = img.convert("L") # grayscale
5 img
AttributeError: module 'PIL.Image' has no attribute 'opem'
4. If it does not look like it some simple misspelling, you might get lucky and find something in Google if you cut-and-paste that error message.
5. If your script shows the original image but not the flipped image, then you likely have a problem with your `flip` function.
6. If your code is at least running and doing something, then insert print statements to figure out what the variables are and how far into the program you get before a craps out. That often tells you what the problem is.
7. Definitely try to solve the problem yourself, but don't waste too much time. I can typically help you out quickly so you can move forward.
Deliverables. Make sure that your images.ipynb file is correctly committed to your repository and pushed to github. Verify this by going to github website. Make sure that it is in the main directory and not a subdirectory of your repository!!!
Task 2. Blurring
In this task, we want to blur an image by removing detail as shown in the images after this paragraph. We will do this by creating a new image whose pixels are the average of the surrounding pixels for which we will use a 3×3 region as shown in the figure below zooming in on Obama's forehead. The pixel in the center of the region is the region to compute as we slide the region around an image. In other words, pixel[x,y] is the sum of pixel[x,y] and all surrounding pixels divided by 9, the total number of pixels.

To implement this, fill in the Blur section of the starterkit. The only difference is that you must call soon-to-be-created function blur not flip as you had before. Now, let's start at the coarsest-level of functionality and realize that we have to walk over every pixel in the image. (This is called top-down design.)
Blurring function
Define function blur, in the cell under section Blur of the starter kit, to take an img parameter, just like the flipfunction in the previous task. In a manner very similar to flip, write code in blur to accomplish these steps:
● Define local variables width and height.
● Make a copy of the incoming image img and save it in a local variable.
● Get the two-dimensional pixel matrix out of the image copy. Store it in a new local variable called pixels.
● Create a nested for loop that iterates over all x and all y values within the width and height of the image.
● Within the inner loop:
○ Call to-be-created function region3x3 with arguments img, x, and y in store into local variable r.
○ Set pixels[x,y] in the image copy to the result of calling to-be-created function avg with an argument of r.
● At the end of the function, return the blurred image.
Define function avg to take an argument called data or another of your choice. This will be the list of 9 pixels returned by function region3x3. The average of a set of numbers is their total divided by how many numbers there are. Python provides two useful functions here: sum(data) and len(data). (Naturally, sum simply walks the list and accumulates values using a pattern we are familiar with.) Make sure that this function returns an integer using int(…).
Image regions
Now we need to define function region3x3. Have it take three parameters as described above. This function creates and return a list of nine pixels. The list includes the center pixel at x, y and the 8 adjacent pixels at N, S, E, W, … as shown in the following figure.
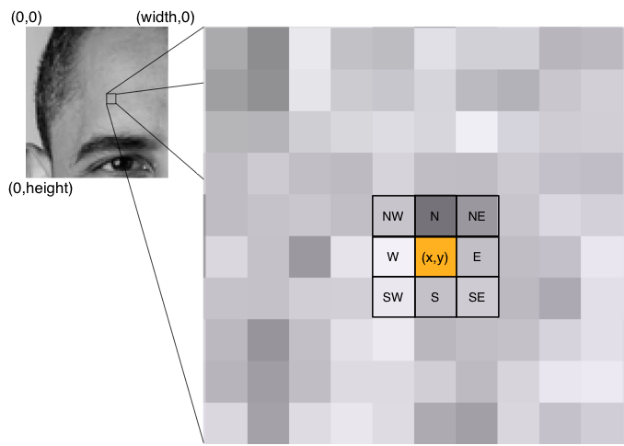
Create a series of assignments that look like this:
me = getpixel(img, x, y)
N = getpixel(img, x, y – 1)
…
where function getpixel(img, x, y) gets the pixel at x, y in image img. We can't use the more readable expression pixels[x,y] in this case, as we'll see in a second. Collect all those pixel values into a list using [a,b,c,…] list literal notation and return it. Make sure that this list is a list of integers and exactly 9 elements long and that you keep in mind the order in which you add these pixels to the list. Any function that we create to operate on a region naturally needs to know the order so we can properly extract pixels from the list. For example, my implementation always puts the pixel at x and y first, then North, etc…
Safely examining region pixels
We need to define a function getpixel instead of directly accessing pixels because some of the pixels in our 3×3 region will be outside of the image as we shift the region around. For example, when we start out at x=0, y=0, 5 of the pixels will be out of range, as shown in the following figure.
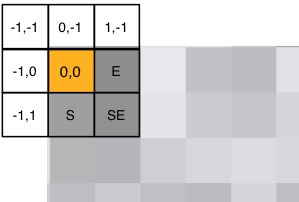
Accessing pixels[-1,-1] will trigger:
IndexError: image index out of range
and stop the program. To avoid this error and provide a suitable definition for the ill-defined pixels on the edges, we will use a function that ensures all indices are within range.
Define function getpixel with the appropriate parameters. Its functionality is as follows:
● Get the width and height into local variables.
● If the x value is less than 0, set it to 0.
● If the x value is greater than or equal to the width, set it to the width minus 1 (the last valid pixel on the far right).
● If the y value is less than 0, set it to 0.
● If the y value is greater than or equal to the height, set it to the height minus 1 (the last felt pixel on the bottom).
● Return the pixel at x, y. You will need to use the img.load() function again to get the 2D pixels matrix as you did in function blur. Make sure you returning pixel and not the coordinates of the pixel from getpixel.
Testing your blur code
That is a lot of code to enter and so more than likely it won't work the first time. (It never does, dang it!) That means we should test the pieces. It's generally a good idea to do top-down design but bottom-up testing. In other words, let's test the simple low-level functions first and make sure that works before testing the functions that call those functions and so on until we reach the outermost script.
With that in mind, lets test avg by passing it a fixed list of numbers to see if we get the right number. You can split up the functions you created so they all exist within their own cells. Then you can test out the avg function with something like this:
avg([1,2,3,4,5])
If it does not print (1+2+3+4+5)/5 = 3, then you know you have a problem in avg.
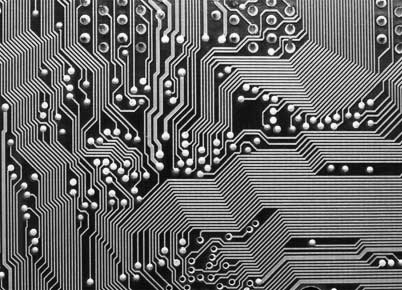
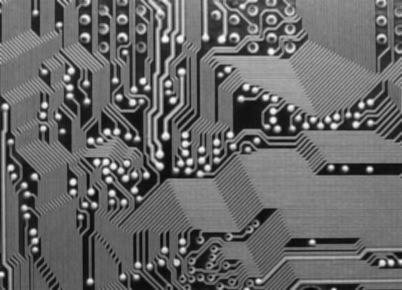
Now test getpixel. You will have to insert some code after loading and converting the image to grayscale because getpixel takes an image parameter. Here's how to try it out on the circuit board image:
img = Image.open("pcb.png")
img = img.convert("L")
print(getpixel(img, 0, 0))
print(getpixel(img, 0, 1))
print(getpixel(img, 10, 20))
That should print: 222, 181, and 44. The upper left corner is near white and pixel 10, 20 is close to black. If you don't get those numbers, then you have a problem with getpixel. Worse, if you don't get a number (e.g., you get a list), then you really have a problem with getpixel.
Before getting to blur, we should also test region3x3 to ensure it gets the proper region surrounding a pixel. Replace those getpixel calls in the print getpixel statements with calls to region3x3. Use the x, y of the upper left-hand corner and somewhere near the upper left of the white section of the logo such as:
print(region3x3(img, 0, 0))
print(region3x3(img, 7, 12))
That checks whether we get an out of range error at the margins and that we get the correct region from somewhere in the middle. Running the cell with that code snippet should give you the following numbers:
[222, 222, 181, 187, 222, 222, 187, 234, 181][31, 31, 32, 167, 176, 166, 165, 164, 175]
That assumes order: current pixel, N, S, E, W, NW, NE, SE, SW.
When you have verified that all of these functions work, it's time to check function blur itself. Try the printed circuit board image, which would look like the right image in the intro paragraph for this task.
It might take 10 seconds or more to compute and display the blurred image, depending on how fast your computer is.

Make sure to remove all of your debugging code before submitting your scripts. Submitting a project that prints out a bunch of random debugging output is considered sloppy, like submitting an English paper with a bunch of handwritten edits.
Deliverables. Make sure that images.ipynb is correctly committed to your repository and pushed to github. Make sure that all of your changes are there.
Task 3. Removing noise
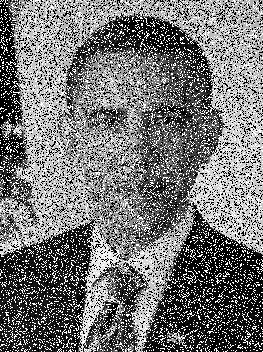
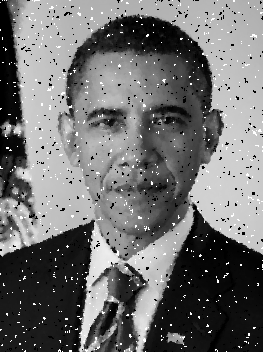
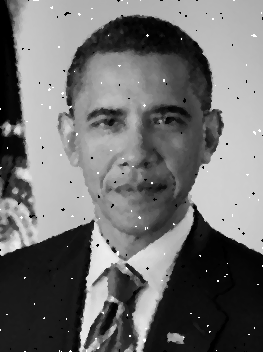
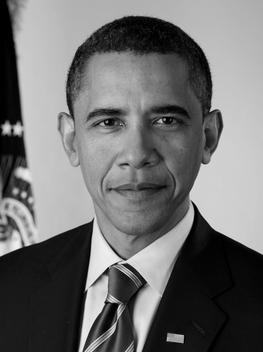
For our next task, we are going to de-noise (remove noise) from an image as shown in the following four figures. It does a shockingly good job considering the simplicity of our approach. To blur, we used the average of all pixels in the region. To denoise, we will use the median, which is just the middle value in a list of ordered numbers (or average of two middle if there are an even number of values).
|
|
|
|
|
|
Believe it or not, we can implement de-noise by copying our blur code into a new cell under section Denoise in the starter kit and then changing a few lines. We also have to remove the no-longer-used avg function and replace it with a median function. Of course, instead of calling blur, we'll call function denoise with the usual img argument. The only difference between denoise and blur is that you will set the pixel to the median not avg. Hint: you need to tweak one statement in the inner loop that moves over all pixel values.
Define function median that, like avg, takes a list of 9 numbers called data. Sort the list using Python's sortedfunction, which takes a list and returns a sorted version of that list. Then compute the index of the middle list element, which is just the length of the list divided by two. If the length is even, dividing by 2 (not 2.0) will round it down to the nearest index. Once you have this index, return the element at that index. Make sure that this function returns an integer using int(…).
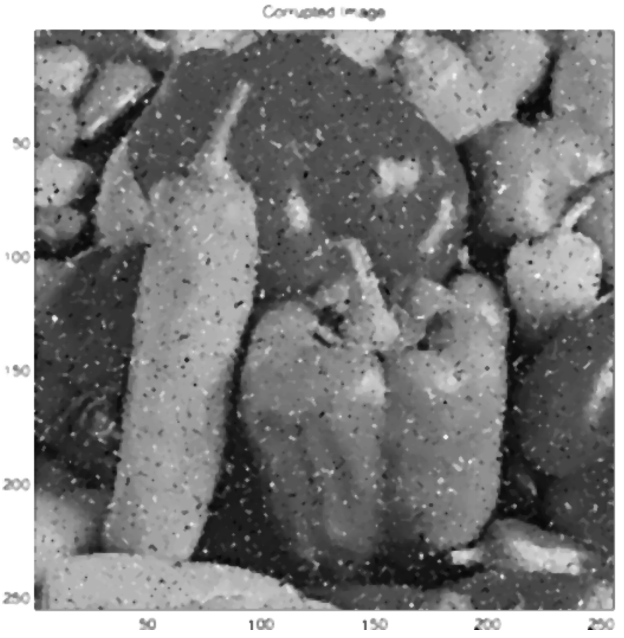
In a code cell, open file Veggies_noise.jpg, display it, then pass it to denoise three times, each time sending the previous return result in as a parameter. The two images should look like:
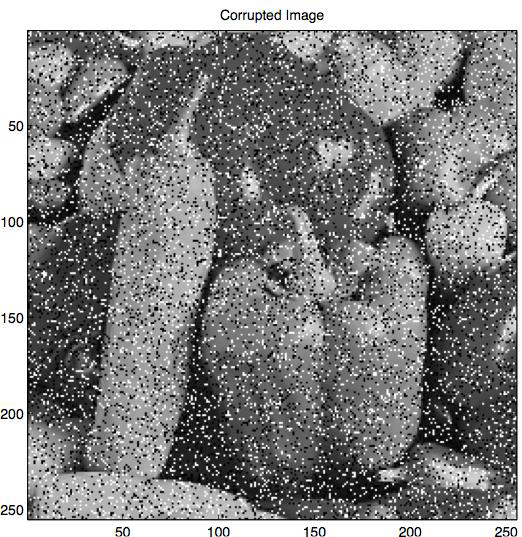
In a code cell, open file guesswho.png, display it, then pass it to denoise. That should show the noisy Obama and the cleaned up version. You can call denoise multiple times to really clean it up. Running denoise twice, gives the cleaned up (third) Obama image above.
Deliverables. Make sure that you have your code and appropriate images displayed in your images.ipynb notebook and that it is correctly committed to your repository and pushed to github.
Task 4. Re-factoring to improve code quality
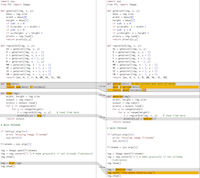
As I mentioned in the last task, blur and denoise are virtually identical, meaning that we have a lot of code in common. The side figure demonstrates this visually. One of the most important principles of computer science is to reduce code duplication. We always want exactly one place to change a particular bit of functionality. In this case, we have the following common code:
● Functions getpixel and region3x3.
● The main part of the script that loads the original image.
● Functions blur and denoise are identical except for the function called to compute a new pixel in the image copy from a 3×3 region in the original (avg or median).
The goal of this task is to reuse as much of the same code as possible for blurring and denoising. Functions getpixel and region3x3 are identical and are already available to us from the definition in previous notebook code cells.
So, let's create a function called open to combines the open and convert function calls:
def open(fname):
img = Image.open(fname)
img = img.convert("L")
return img
That lets us do things like:
img = open('pcb.png')
The only tricky bit (pun intended) is to create a single generic filter function that can reproduce the functionality we have in functions blur and denoise.
● Define function filter to take img and f parameters.
● Copy the body of function blur into your new filter function.
● Replace the call to avg(r) with f(r).
As we discussed in class, functions are objects in Python just like any strings, lists, and so on. That means we can pass them around as function arguments. To use our new generic filter function, we pass it an image as usual but also the name of a function:
blurred = filter(img, avg)
denoised = filter(img, median)
|
Don't confuse the name of a function with an expression that calls it. Assignment f = avg makes variable frefer to function avg. f = avg() calls function avg and stores the return value in variable f. Using f = avg, we can call avg with expression f(). You can think of f as an alias for avg. |
In the end, we now have 4 generically useful functions: getpixel, region3x3, filter, and open.
Armed with this awesome new common functionality, blurring and image shrinks to the following tiny script:
img = open('some file')
img = filter(img, avg) # blur me please
img # show me
Denoising is also tiny:
img = open('some file')
img = filter(img, median) # denoise me please
img
|
Yep, these files are identical except for the fact that we call filter with different function names. If you wanted to get really fancy, you could replace both of these scripts with a single script that took a function name as a second argument (after the image filename). With some magic incantations, you'd then ask Python to lookup the function with the indicated name and pass it to function filter instead of hard coding. |
 Before finishing this task, be a thorough programmer and test your new scripts to see that they work. Please add cells to show pcb.png and blur it. Then do the same for denoising guesswho.png.
They should work, but unfortunately that is never good enough in the programming world. Lot of little things can go wrong. Certainty is always better than likelihood.
Deliverables. Make sure that you commit your appropriate changes and push the results back to the repository at github.
Task 5. Highlighting image edges
Now that we have some basic machinery available to us in the form of some common functions, we can easily build new functionality. In this task, we want to highlight edges found within an image. It is surprisingly easy to capture all of the important edges in an image:
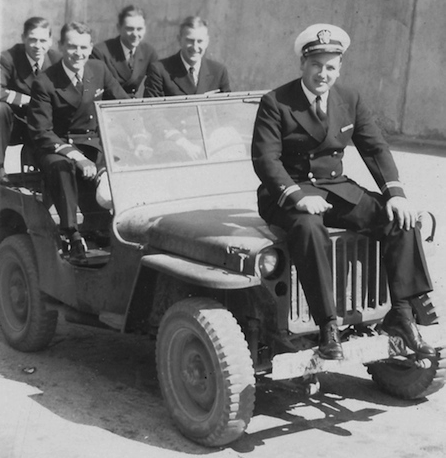
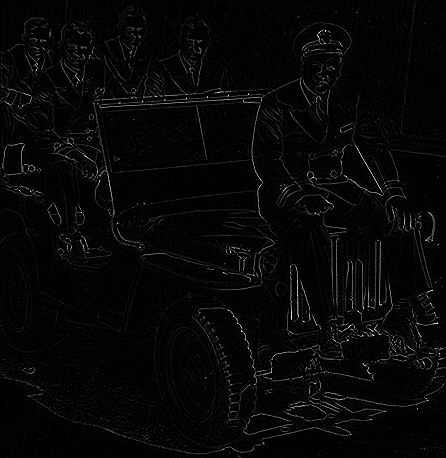
The mechanism we're going to use is derived from some serious calculus kung fu called the Laplacian, but which, in the end, reduces to 4 additions and a subtraction! The intuition behind the Laplacian is that abrupt changes in brightness indicate edges, such as the transition from the darkness of a uniform to the brightness of a windshield edge. As we did for blurring and denoising, we are going to slide a 3×3 region around the image to create new pixels at each x, y. That means we can reuse our filter function—we just need a laplace function to pass to filter.
To get started, here is the boilerplate code you need to load and get the edges for Obama:
# define function laplace here
…
img = open('obama.png')
display(img)
edges = filter(img, laplace)
edges
Create function laplace that takes region data as an argument as usual. Have the function body return the sum of the North, South, East, and West pixels minus 4 times the middle pixel from our usual region:
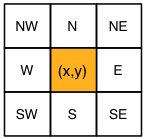
That computation effectively compares the strength of the current pixel with those around it. For example, imagine a region centered over a vertical white line. The region might look like:
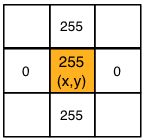
The laplace function would return 255+255+0+0 – 4 * 255 = -510.

For those familiar with calculus, we are using the second partial derivative (i.e., acceleration) in x and y directions. The first derivative would detect edges even for gradual changes but the second derivative detects only really sharp changes. For a pixel fetching function f operating on a 3×3 region around (x,y), "applying the Laplacian" means computing a filtered image pixel at x,y as:
f(x + 1,y) + f(x – 1,y) + f(x,y + 1) + f(x,y – 1) – 4f(x, y)
where f(x,y) is equivalent to our pixels[x,y].
|
Be aware of something that Pillow is doing for us automatically when we store values into an image with pixels[x,y] = v. If v is out of range 0..255, Pillow clips v. So, for example, pixels[x,y] = -510 behaves like pixels[x,y] = 0 and pixels[x,y] = 510 behaves like pixels[x,y] = 255. It doesn't affect edge detection or any of our other operations in future tasks but I wanted to point out that in a more advanced class we would scalethese pixel values instead of clipping them. Clipping has the effect of reducing contrast. |
Compare that to the opposite extreme where values are almost the same:
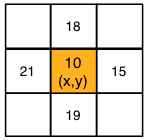
The laplace function would return 18+19+15+21 – 4 * 10 = 33.
Once you have implemented your laplace function, give it a try on images obama.png and phobos2.jpg. It actually does a really good job capturing Obama's outline:
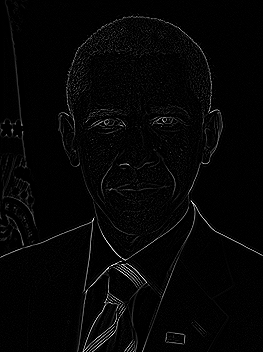
Deliverables. Make sure that you show the edges for Obama and the asteroid and have a correct laplace function in the appropriate section of images.ipynb. Make sure that the file is correctly committed to your repository and pushed to github.
Task 6. Sharpening
Sharpening an image is a matter of highlighting the edges, which we know how to compute from the previous task. Now, let's work in the Sharpen section of the starter kit. Instead of just computing the edges, we subtract that white-on-black edges image from the original. You might imagine that adding the edges back in would be more appropriate and it sort of works, but the edges are slightly off. We get a better image by subtracting the high-valued light pixels because that darkens the edges in the original image, such as between the uniform and the windshield. Let's start with the easy stuff:
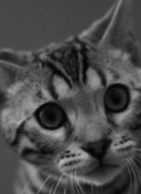
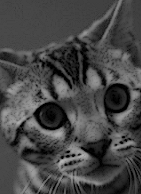

● Reuse your previous code for detecting edges to load an image and apply the Laplace filter.
● After edges = filter(img, laplace), add a line that calls a function we'll create shortly called minus. minustakes two image parameters, A and B and returns A-B. In our case, pass in the original image and the image you get back from calling filter(img, laplace).
● Show the image return result of the minus function.
That only leaves the task of creating function minus to subtract the pixels of one image from the pixels of another image like a 2-D matrix subtraction. As we did before, we will return a modified version of a copy of an incoming image parameter. (In my solution, I arbitrarily chose to create and return a copy of A.) Because you are getting really good at creating functions to manipulate images, the instructions for creating minus in this task are less specific than in previous tasks. You need to fill in the body of this function:
# Return a new image whose pixels are A[x,y] – B[x,y]
def minus(A, B):
…
The mechanism is the same as before: iterating loop variables x and y across the entire image and processing the pixel at each location. The only difference between this function and filter is that we want to operate on individual pixels not 3×3 regions. In the inner loop, set pixels[x,y] to the value of pixel A[x,y] minus pixel B[x,y]. Don't forget to return the image you filled in.
Add a cell to load and display bonkers.png then show the sharpened image. Do the same for image phobos2.jpg.
This simple process of subtracting the Laplacian does an amazing job. Here's the before and after photo of the asteroid:
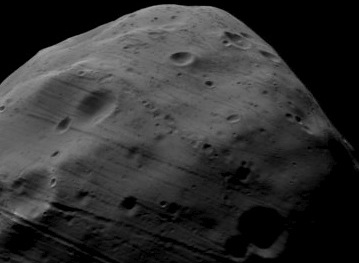
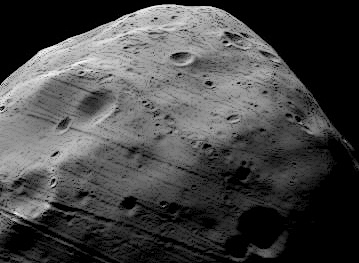
Deliverables. Make sure that your images.ipynb is correctly committed to your repository and pushed to github.
Expected results
For your reference, here is the expected sequence of images and sections with all of the code cells hidden (though the relative sizes of those images might be different in your output):
|
|
|
|
代写CS&Finance|建模|代码|系统|报告|考试
编程类:C代写,JAVA代写 ,数据库代写,WEB代写,Python代写,Matlab代写,GO语言,R代写
金融类:统计,计量,风险投资,金融工程,R语言,Python语言,Matlab,建立模型,数据分析,数据处理
服务类:Lab/Assignment/Project/Course/Qzui/Midterm/Final/Exam/Test帮助代写代考辅导
天才写手,代写CS,代写finance,代写statistics,考试助攻
E-mail:[email protected] 微信:BadGeniuscs 工作时间:无休息工作日-早上8点到凌晨3点
如果您用的手机请先保存二维码到手机里面,识别图中二维码。如果用电脑,直接掏出手机果断扫描。

