
ISE 529 Predictive Analytics Exam 2
预测分析考试代写 1. The Caravan.csv data set has information of 5822 individuals whom the Caravan insurance was offered. The variable Purchase
1. 预测分析考试代写
The Caravan.csv data set has information of 5822 individuals whom the Caravan insurance was offered. The variable Purchase (with categories Yes and No) indicates if an individual purchased the insurance.
It can be verified that, in the dataset, only 348 individuals purchased the insurance policy. Thus, the data set is said to be imbalanced. And a strategy that predicts No always, would get a test error rate of 6% regardless of the predictor values. It seems that a predictive model should have a smaller error rate. But that is not important since the analyst should focus in a different rate, as explained below.
If the Caravan company tries to sell the insurance to any potential customer then the success rate would be 6%, which is not an effective marketing strategy. The company should rather focus on selling their insurance to customers who are likely to buy it. That is, to target their marketing effort in individuals who are predicted to buy it. Thus, the error rate of interest is the fraction of individuals who are correctly predicted to buy the insurance policy. We call this fraction the precision.
Consider for example that the confusion matrix that results from a classification model used with the Caravan data is
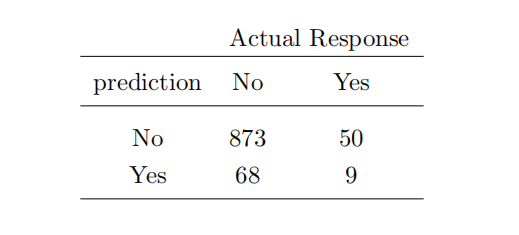
For this model the precision is 9/(68 + 9) = 0.117 which is an improvement over 6%.
We want a model that results in the largest (test set) precision. To that end, remove the variables PVRAAUT and AVRAAUT from the dataset. Create a test set consisting of the fifirst 1,000 observations, and a train set with the remaining observations. Report the test set precision for the following models.
a)
A random forest model with 500 trees, max_features = 29, andrandom_state = 0.
b) A boosting model with max_depth = 4. Use 1000 trees, learning rate 0.01,and random_state = 0.
c) A multilayer perceptron with three hidden layers having 400 nodes each as follows
MLPClassifier(solver=’lbfgs’,random_state = 0,
              activation = ’tanh’,hidden_layer_sizes=[400,400,400])
d) Logistic regression with the default value for C.
e) Repeat part (d) with a cut-off probability value equal to 0.25. LogisticRegression uses 0.50 as cut-off default value. It uses the cut-offff value to predict the category. If the probability is larger than 0.5 the model predicts category Yes, otherwise it predicts No. Function predict_proba( ) may help to this end.
2. 预测分析考试代写
scikit-learn has a dataset of gray photos of public people. We want to build a classification model to predict the person’s name from a new photo. Different individuals have different number of photos in the data. The following lines collect the photos of individuals with at least 60 photos in the dataset.
from sklearn.datasets import fetch_lfw_people
faces = fetch_lfw_people(min_faces_per_person = 60)
The size of each array is given by
print(faces.images.shape,faces.data.shape,faces.target.shape,faces.target_name shape)
There are 1348 photos each 62 × 47 pixels large belonging to 8 different people (their names are in faces.target_names.). The 3D array faces.images stores the photos (1348 arrays of size 62 × 47). The array faces.data stores each photo in a row of length 62 × 47 = 2914. The features of the model are in X = faces.data and the response (target) variable in y = faces.target. Split the dataset into a train (75%) and a test set (25%). Use (random_state = 42). No need to scale the data.
a) (10 pts.) 预测分析考试代写
Fit an SVC model as shown. Find the test accuracy rate.
svc = SVC(kernel=’rbf’, gamma = 0.01)
model = make_pipeline(svc)
model.fit(Xtrain, ytrain);
b) (10 pts.)
To improve the model accuracy we will transform the features using Principal Components, a topic we review in ISE 535. Use first 150 principal components as the new features of the model, as shown below, then report the test accuracy rate.
from sklearn.decomposition import PCA
pca = PCA(n_components=150, svd_solver=’randomized’,whiten=True,random_state=42)
svc = SVC(kernel=’rbf’, gamma = 0.01)
model = make_pipeline(pca,svc)
model.fit(Xtrain, ytrain);
c) (10 pts.)
Add argument class_weight=’balanced’ to the SVC() line above, run the code again and find the accuracy rate. Here we modify the loss function by weighting the loss of each row category by its class weight.
d) (10 pts.) 预测分析考试代写
Use GridSearchCV to search best values for C and gamma. Try the grid values shown below.
Report the test accuracy rate.
pca = PCA(n_components=150, svd_solver=’randomized’,whiten=True,random_state=42)
svc = SVC(kernel=’rbf’, class_weight=’balanced’)
model = make_pipeline(pca,svc)
param_grid = {’svc__C’: [1, 5, 10],
              ’svc__gamma’: [0.0001, 0.0005, 0.001, 0.005]}
grid = GridSearchCV(model, param_grid,cv=5,iid = True)
grid.fit(Xtrain, ytrain)
model = grid.best_estimator_
e) (10 pts.)
Report the confusion matrix (for test set) of the best model in a dataframe with rows identifying the true name of the person and columns identifying the predicted name. What person has the largest error rate (that is, the person that is most difficult to predict)?
Your report must
- show your name and USC ID on the first page.
- be made of letter size pages in portrait format (not landscape).
- show Python commands fully displayed and not truncated.
Name your pdf file with your Name followed by your USC ID, for example cesar_acosta – 0123456789.pdf.
Then submit your file onto Blackboard on the submission date.

更多代写:css作业代写 多邻国代考 英国online course作业代写 澳洲essay代写 presentation代写 金融概论代写
