Foreign direct investment and financial market integration
–— Analysis based on China
金融论文代写 The study adopts the same method of Shi et al. (2010), in which the Geweke (1982) measurement of stock market integration is applied.
Table of content
Chapter 1: Introduction………………………………………………………………………..2
Section 1: Research background……………………………………………………………2
Section 2: Research question and organization………………………………………3
Chapter 2: Literature review………………………………………………………………..4
Chapter 3: Model and estimation strategy……………………………………………..5
Chapter 4: Data and measurements………………………………………………………5
Section 1: Data source and sampling method…………………………………………5
Section 2: Variable formation and summary analysis……………………………..6
Chapter 5: Estimation results……………………………………………………………….8
Section 1: Baseline analysis…………………………………………………………………..8
Section 2: Robustness check…………………………………………………………………8
Chapter 6: Discussion and conclusion……………………………………………………10
Reference list………………………………………………………………………………………13
Chapter 1: Introduction 金融论文代写
Section 1: Research background
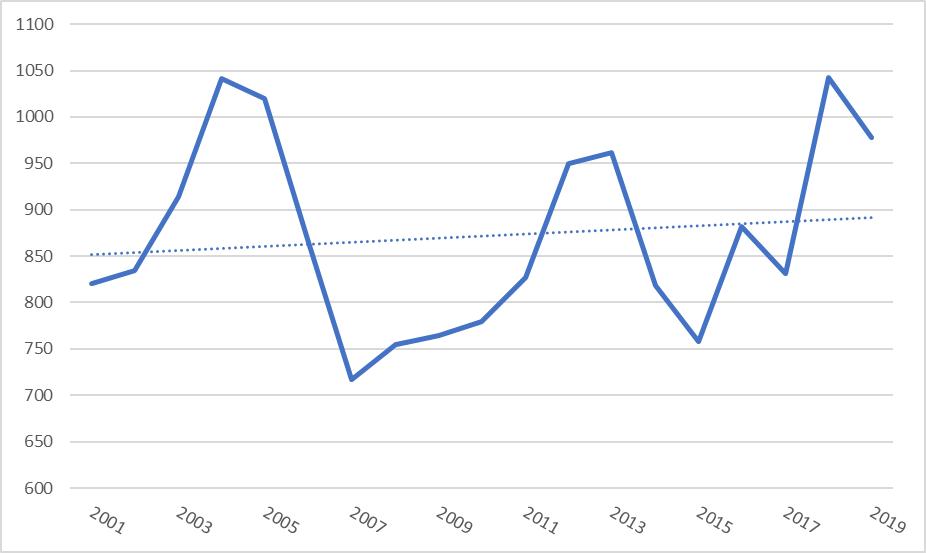
Upon joining in the WTO (World Trade Center), China is increasingly integrated with the global economy. Figure 1 depicts the average amount of international trade between China and its twenty major trade partners, which suggests a quite steady trend of increase over the past two decades. Specifically, while the average bilateral trade amount is only 15.24 billion USD in 2001, it expands to more than five times to 118.21 billion USD in 2019. Meanwhile, there is also an increase of FDI (Foreign Direct Investment) from these countries to China. As is illustrated in figure 2, the average amount of FDI from these twenty countries to China is also on an increasing path. In detail, while average FDI hosted by China amounts to 820.04 million in 2001, it increases by a fifth to 977.77 million in 2019.
Figure 1: Average bilateral trade amount (constant 2015 USD, billion)
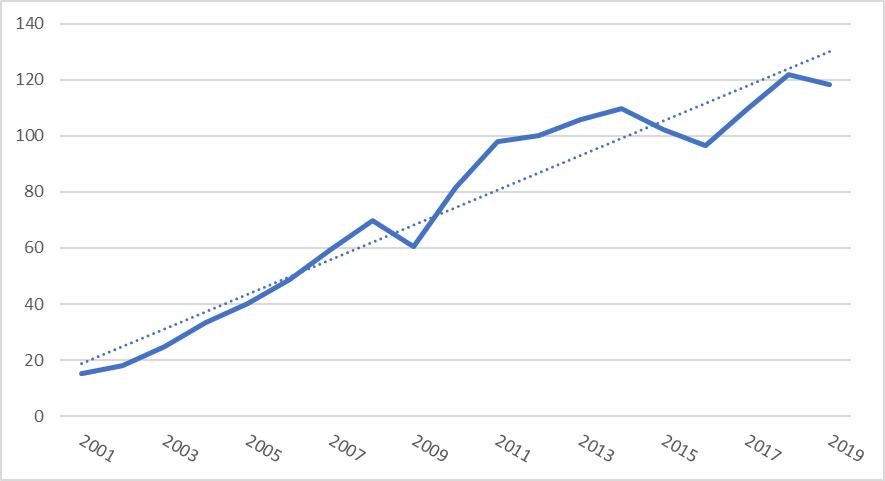
Figure 2: Average FDI toward China (constant 2015 USD, million)
Following the increased integration into global economic activities, there is also an effort for China to become integrated with the global financial market. While foreign investors used to be constrained to trade only the B-share stocks, the A-share (the major block) stock market is opened to foreign investors through the QFII (Qualified Foreign Institutional Investors) program in 2002. In addition, with the QDII (Qualified Domestic Institutional Investors) program established in 2012, professional traders in China are allowed to make investment in security markets of foreign countries. By the end of 2020, more than 200 foreign institutions have joined the Chinese stock market through the QFII program.
Section 2: Research question and organization
Since bilateral trade and FDI activities facilitate the flow of foreign capital in ad out of Chinese market and strengthen the economic relationship between China and foreign countries, the integration in economy activities could be transmitted to the financial market and enhances the integration of Chinese stock market with the global financial market as well. This study intends to examine such a hypothesis and check if hosting FDI has increased the co-movement of Chinese stock market with the home countries. The rest of the study consists of five chapters, discussing the literature background, econometrics methods, data source, empirical analysis, as well as the conclusion respectively.
Chapter 2: Literature review 金融论文代写
According to Moosa (2002), foreign direct investment (FDI) reflects an integration of economic activities between two countries as the home country makes direct investment and acquires ownership of assets in the host country. FDI activities is found to enhance the economic performance of the home country through multiple channels. For instance, Fetscherin et al. (2010) argue that the improvement of corporate governance following FDI inflow leads to a better financial performance of Chinese companies. Besides, there is also spillover effect of FDI activities, which is found to improve corporate social responsibility (Bu et al., 2013) as well as environmental problem awareness (Zomorrodi and Zhou, 2017). 金融论文代写
More importantly, strengthened economic relationship between countries through FDI activities is found to enhance the integration of financial market between countries as well. For example, in the analysis of three Asian countries with ASEAN5 countries, Wu (2020) find that macroeconomic variables are able to explain the closer association between stock markets. A corresponding explanation is provided in the early study of Dorodnykh (2013), as cross holding of stocks with foreign countries increases with the tightened economic relationships. This argument is confirmed in the study of Australia with its large trade partners in the analysis of Shi et al. (2010), as well as in the analysis of countries within East Asian Economic Community by Sehgal et al. (2018).
Chapter 3: Model and estimation strategy
The identification of the impact of economic integration on stock market integration is quite straight forward. To begin with, two simple OLS regression is performed to check for the impact of FDI inflow and trade amount respectively.
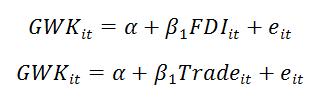
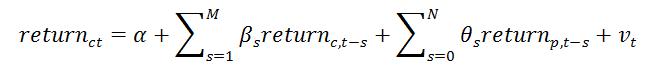
Next, to estimate the partial impact of FDI inflow and trade, the two are combined in the multivariate regression model as:
![]()
Besides, in order to control for the impact of financial crisis on stock market spillover effect, the dummy variable of post-crisis period is added in. And the continent fixed effects () are included to take care of the continent heterogeneity. 金融论文代写

Moreover, as a way to check for the robustness of estimation with respect to potential country level heterogeneity, a fixed effect model is proposed as:![]()
Where the intercept term captures all the unobserved effect at the country level such as its distance and national relationship with China.
Chapter 4: Data and measurements
Section 1: Data source and sampling method
To analyze how FDI and bilateral trade affect the extent of stock market integration, twenty large trade partners with China are selected as the cross-sectional unit and a twenty-year horizon from 2000 to 2019 is selected as the time units. For each of the twenty countries, stock market index is retrieved from the WRDS database, and the amount of bilateral trade as well as FDI toward China is collected from Chinese Bureau of Statistics. To avoid the problem of simultaneity, a dynamic model with one year lagged regressors is applied and the corresponding effective sample size after excluding observations with missing values is 348.
Section 2: Variable formation and summary analysis
The study adopts the same method of Shi et al. (2010), in which the Geweke (1982) measurement of stock market integration is applied. The variable construction reflects the increased information on return prediction when market condition of the foreign country is added in the autoregression of daily Chinese stock returns. There are two steps to generate the Geweke (1982) measurement. 金融论文代写
In the first step, autoregression of Chinese stock market is conducted based on the model as follow:
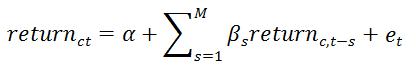
In which the number of lags, M, is chosen to be five days, ten days, and twenty days respectively to represent one-week to one-month predictive power of lagged stock return series. Then the residual sum of squares from the regression is retained as RSS1. 金融论文代写
In the second step, lagged daily returns from the foreign stock market is added, and the following augmented function is estimated:
The corresponding residual sum of squares is retained as RSS2 from this regression.
Then Geweke (1982) proposes to measure stock market integration with the formula of
![]()
Where a larger value indicates a closer co-moving relationship between the two stock markets.
Approximately, the Geweke (1982) measurement of stock market integration minus one can be interpreted as the percentage increase of variation explained by the augmented model.
Table 1: Summary statistics
| VarName | Obs | Mean | SD | Min | P25 | Median | P75 | Max |
| fdi (billion USD) | 348 | 0.905 | 1.522 | 0.001 | 0.069 | 0.287 | 0.791 | 7.591 |
| trade (billion USD) | 350 | 72.585 | 103.195 | 0.905 | 14.243 | 42.065 | 79.740 | 633.519 |
| GWK5 | 350 | 1.090 | 0.051 | 1.023 | 1.053 | 1.076 | 1.118 | 1.324 |
| GWK10 | 350 | 1.132 | 0.054 | 1.041 | 1.094 | 1.123 | 1.162 | 1.367 |
| GWK20 | 350 | 1.211 | 0.063 | 1.101 | 1.165 | 1.199 | 1.246 | 1.614 |
Table 1 shows the summary statistics of variables, which suggests that average FDI inflow and bilateral trade are 0.905 million USD and 72.585 million USD respectively. Besides, it indicates that the stock return of the foreign market on average improves the prediction of Chinese stock market by 9%, 13.2%, and 21.1% respectively for the one-week to one-month measurement horizons.
Table 2: Correlation coefficients
| fdi | trade | GWK5 | GWK10 | GWK20 | |
| fdi | 1 | 0.459 | 0.126 | 0.137 | 0.105 |
| trade | 0.516 | 1 | 0.448 | 0.407 | 0.289 |
| GWK5 | 0.319 | 0.252 | 1 | 0.895 | 0.705 |
| GWK10 | 0.288 | 0.238 | 0.927 | 1 | 0.817 |
| GWK20 | 0.235 | 0.130 | 0.687 | 0.814 | 1 |
Then table 2 depicts the correlation coefficients between variables. It yields a preliminary result that both FDI inflow and trade amount are positively related to stock market integration. Besides, the high correlation coefficients between stock market integration measured over different time intervals suggests the consistency of Geweke measurement. In addition, since the correlation between FDI inflow and trade amount is lower than 0.6, the estimation is not supposed to suffer from the problem of muticollinearity.

Chapter 5: Estimation results 金融论文代写
This section presents the estimation results along with checking its robustness to different response variable formations and different model specifications. The corresponding discussion is divided into two sections as follow.
Section 1: Baseline analysis
To begin with, table 3 documents the benchmark results estimated with OLS method, which indicates four pieces of information worthy of discussion.
Firstly, FDI activities has a positive impact on stock market integration. To be specific, in the single variable OLS regression, one million USD increase of FDI from foreign countries toward China enhances stock market integration by 10.34%, which is statistically significant at 0.1% level. Moreover, while there is a slight reduction of magnitude, the positive relationship between FDI and stock market integration remains statistically significant with the inclusion of control variables. Specifically, when both bilateral trade amount and continent heterogeneity are controlled for, the impact reduces to 7.7% increase of stock market integration per million USD increase of FDI, while remains statistically significant at the level of 0.1%.
Secondly, while bilateral trade amount is positively associated with the degree of stock market integration, the relationship fades away when FDI is taken into consideration.
In detail, in the single variable OLS estimation of the second model, one billion USD increase of international trade leads to an increased bilateral stock market integration by 1.258%, which is statistically distinguishable form zero at the level of 0.1%. 金融论文代写
However, when the impact of FDI as well as global financial crisis are included, such a positive influence of trade activities disappears and the coefficient of trade amount becomes negative and statistically insignificant. Further, the result is consistent when continent level difference is considered in the last two columns, which indicates that the positive influence estimated in the second model is a result of omitted variable bias. To sum up, while bilateral trade is found to enhance stock market integration, its impact is rather an indirect one through the increased FDI intensity associated with the deepened international trade relation.
Thirdly, while there is a little evidence that stock market integration is weaker for European countries, there is no overall statistically significant continent difference.
While regional stock market integration is supposed to be stronger than global stock market integration due to the contagion of regional economic shocks, table 3 provides little evidence in support of the hypothesis.
Specifically, while the fourth model indicates that level of stock market integration is lower for countries outside Asia (after controlling for trade and FDI), the four continent dummy variables are not jointly significant at the level of 5%. In addition, in the last column, stock market integration is not shown to be stronger in between China and its Asian partners either before and after the global financial crisis. 金融论文代写
Lastly, global financial crisis is found to deepen the contagion effect between stock markets.
To be specific, the last three models suggests that after controlling for economic integration and continent heterogeneity, average level of stock market integration increase by around 0.4% to 0.47% after the worldwide financial crisis. While the impact of crisis is to a rather small economic magnitude compared with the impact of FDI, it is statistically significant at the level of 0.1% and robust across all three estimations.
Putting together, table 3 confirms he hypothesis that FDI activities facilitate financial market integration. In addition, from the aspect of model fitness, the combined effect of FDI, bilateral trade, and post crisis dummies explains more than a fourth of the variation in stock market integration. Further, the explanation power increases to 27% of the variation in response variable when continent level difference is taken into consideration.
Table 3: Baseline estimation with OLS
| (1) | (2) | (3) | (4) | (5) | |
| fdi | 10.34*** | 9.606*** | 7.700*** | 8.239*** | |
| (1.846) | (1.953) | (2.181) | (2.034) | ||
| trade | 1.258*** | -0.120 | -0.0751 | -0.0495 | |
| (0.275) | (0.299) | (0.342) | (0.299) | ||
| crisis | 0.0473*** | 0.0473*** | 0.0403*** | ||
| (0.00544) | (0.00547) | (0.00662) | |||
| Europe | -0.0162* | ||||
| (0.00692) | |||||
| North America | -0.0142 | ||||
| (0.0108) | |||||
| Oceania | -0.0106 | ||||
| (0.00983) | |||||
| South America | -0.00851 | ||||
| 金融论文代写 | (0.0131) | ||||
| asia | -0.000136 | ||||
| (0.00856) | |||||
| asia_crisis | 0.0192 | ||||
| (0.0108) | |||||
| _cons | 1.123*** | 1.123*** | 1.096*** | 1.108*** | 1.097*** |
| (0.00326) | (0.00346) | (0.00425) | (0.00709) | (0.00507) | |
| N | 348 | 350 | 348 | 348 | 348 |
| R2 | 0.083 | 0.057 | 0.257 | 0.270 | 0.273 |
| adj. R2 | 0.081 | 0.054 | 0.251 | 0.255 | 0.263 |
Standard errors in parentheses
* p < 0.05, ** p < 0.01, *** p < 0.001
Section 2: Robustness check
While the analysis of the previous section is based on an OLS estimation with ten-day stock market integration, its robustness to alternative variable choice and model specification is detected in this section.
To start with, table 4 reports the OLS estimation of the fifth model in table 3 with one week and one month stock market integration. By and large, table 4 yields a consistent finding as is discussed before. Specifically, one million USD increase of FDI inflow is found to increase stock market integration by 8.97% and 9.58% for one week and one month measures respectively. Besides, both of the two coefficients are statistically significant at the level of 0.1%. 金融论文代写
Meanwhile, no impact of bilateral trade is documented, while financial crisis is again found to enhance stock market integration.
Moreover, while the level of stock market integration is stronger for Asian countries, and deepened further after the global financial crisis, the joint hypothesis test of Asia dummy together with its interaction term fails to reject the null hypothesis of no continent effect, which is in line with the analysis based on ten-day stock market integration in the previous section. One last thing to note is the fitness of model, which suggests that the explained variation in stock market integration reduces with longer time horizon. A possible cause for the phenomenon is the increased noise in stock market integration measures when time horizon is expanded.
Table 4: Robustness check with alternative integration measurements
| one-week | ten-day | one-month | |
| fdi | 8.968*** | 8.239*** | 9.580*** |
| (1.802) | (2.034) | (2.561) | |
| trade | -0.175 | -0.0495 | -0.471 |
| (0.265) | (0.299) | (0.376) | |
| crisis | 0.0457*** | 0.0403*** | 0.0333*** |
| (0.00587) | (0.00662) | (0.00834) | |
| asia | 0.00178 | -0.000136 | 0.00350 |
| (0.00758) | (0.00856) | (0.0108) | |
| asia_crisis | 0.0153 | 0.0192 | 0.0100 |
| 金融论文代写 | (0.00953) | (0.0108) | (0.0135) |
| _cons | 1.052*** | 1.097*** | 1.183*** |
| (0.00449) | (0.00507) | (0.00639) | |
| N | 348 | 348 | 348 |
| R2 | 0.346 | 0.273 | 0.136 |
| adj. R2 | 0.337 | 0.263 | 0.124 |
Standard errors in parentheses
* p < 0.05, ** p < 0.01, *** p < 0.001
Except for measurement of stock market integration, the other worry about the robustness of previous findings lies in the unobserved heterogeneity of countries.
For instance, information related to stock price fluctuation could transmit more conveniently across countries that are geographically close and within the same time zone. Besides, the various official language used in different countries could also sever as an obstruction to information transmission. Omitting these issues in the baseline model could lead to biased estimators as well. To deal with this problem, the study relies on the assumption that unobserved heterogeneity at the country level is stable over time. Under this assumption, a fixed effect estimation is applied to control for time-invariant unobserved variables and the corresponding results is shown in table 5 below.
Table 5: Robustness check with fixed effect regression
| (1) | (2) | (3) | |
| fdi | 16.24*** | 13.02** | 8.695** |
| (4.279) | (4.287) | (3.025) | |
| trade | 5.470*** | 3.463*** | 1.304* |
| (0.638) | (0.793) | (0.620) | |
| crisis | 0.0230** | 0.0227 | |
| (0.00720) | (0.0122) | ||
| asia_crisis | 金融论文代写 | 0.0103 | 0.0160* |
| (0.0108) | (0.00753) | ||
| _cons | 1.078*** | 1.079*** | 1.127*** |
| (0.00613) | (0.00606) | (0.00856) | |
| Year effect | uncontrolled | uncontrolled | controlled |
| N | 348 | 348 | 348 |
| R2 | 0.233 | 0.271 | 0.667 |
| adj. R2 | 0.183 | 0.219 | 0.623 |
Standard errors in parentheses
* p < 0.05, ** p < 0.01, *** p < 0.001
The first column suggests an even stronger impact of economic integration on stock market integration between China and its twenty trade partners.
Specifically, ceteris paribus, one million USD increase of FDI inflow is expected to enhance stock market integration by 16.24%, which is nearly twice the estimation compared with table 3. Besides, a positively significant influence of bilateral trade is documented as one billion USD increase of trade amount is found to increase stock market integration by 5.47%. It is worth noting that although trade is found to have a statistically significant impact in the fixed effect estimation, its economic magnitude is far less than FDI inflow, as the effect of one billion USD more trade is equal to a third of the effect from one million USD increase of FDI inflow. 金融论文代写
Then the second model suggests a reduced impact when crisis dummy is included, and the estimation further reduces when the time effect is controlled for. In fact, in the third model, the estimated partial effect of FDI inflow is of a similar level as in table 3. A possible explanation to the reduction is the problem of a common trend. Specially, as both economic integration and stock market integration are enhanced over time, the estimation without controlling for time effect tend to overestimate the influence of FDI activities on financial markets. Nonetheless, after the exclusion of common time trend, the third column still indicates a positively significant effect of FDI inflow and bilateral trade on stock market integration at the level of 0.1% and 5% respectively.
Chapter 6: Discussion and conclusion 金融论文代写
The study intends to check for the impact of economic integration on financial market integration based on recent two decades data of China with its twenty major trade partners. The baseline results suggest a positive impact of FDI inflow on stock market integration, while the fixed effect estimation reinforces such a finding. Specially, a one million increase of FDI inflow in general increases stock market integration by around 9% using the Geweke (1982) measurement. The corresponding policy implication is that strengthened integration of economic activities enhances the transmission of information across countries, which reduces the potential gain of international diversification when making foreign stock market investment.
Reference list
Bu, Maoliang, et al. “Corporate social responsibility and the pollution haven hypothesis: Evidence from multinationals’ investment decision in China.” Asia-Pacific Journal of Accounting & Economics 20.1 (2013): 85-99.
Dorodnykh, Ekaterina. Stock market integration: An international perspective. Springer, 2013.
Fetscherin, Marc, Hinrich Voss, and Philippe Gugler. “30 Years of foreign direct investment to China: An interdisciplinary literature review.” International business review 19.3 (2010): 235-246.
Moosa, Imad. Foreign direct investment: theory, evidence and practice. Springer, 2002.Sehgal, Sanjay, Piyush Pandey, and Florent Deisting. “Stock market integration dynamics and its determinants in the East Asian Economic Community Region.” Journal of Quantitative Economics 16.2 (2018): 389-425. 金融论文代写
Shi, Jing, et al. “Foreign direct investment and international stock market integration.” Australian Journal of Management 35.3 (2010): 265-290.
Wu, Fei. “Stock market integration in East and Southeast Asia: The role of global factors.” International Review of Financial Analysis 67 (2020): 101416.
Zomorrodi, Ahmad, and Xiaoyan Zhou. “Impact of FDI on environmental quality of China.” International Journal of Business, Economics and Management 4.1 (2017): 1-15.