
STA130H1F – Fall 2020
Week 4 Problem Set
STA130H1F代写 There are two parts to your problem set. One is largely R-based with short written answers and the other is more focused on writing.
Problem set grading
There are two parts to your problem set. One is largely R-based with short written answers and the other is more focused on writing. We recommend you use a word processing software like Microsoft Word to check for grammar errors in your written work. Note: there can be issues copying from Word to R Markdown so it may be easier to write in this file first and then copy the text to Word. Then you can make any changes flagged in Word directly in this file.
Part 1
[Question 1] STA130H1F代写
Approximately 10% of the general population is left-handed. Suppose that the Department of Statistical Sciences (DoSS) is conducting a study to see if this percentage is the same among their undergraduate students (that is, all students in an undergraduate DoSS statistics program). This would help inform classroom renovations and bookings to ensure suffiffifficient left-handed (and right-handed) seating. Suppose 500 students in statistics programs are randomly selected and asked whether or not they are left-handed. Suppose that 61 of these 500 students respond that they are left-handed.
a)
What are appropriate null and alternative hypotheses to test the claim? Make sure you defifine the parameter in context.
Answer The null hypothesis is that the proportion of left-handed people is 10% among undergraduate students in DoSS.
H0 : p0 = 0.1
And the alternative assumption HA : p0 = 0.1, that the proportion is not 10%.
b)STA130H1F代写
Use the sample() function to simulate the number of left-handed students in a random sample of 500 DoSS students, assuming that the prevalence of left-handedness is the same among DoSS students as it is in the general population. How many left-handed students did you have in your simulated sample of 500 students? How does this simulated count compare to the results of the handedness study (i.e., that 67 of the 500 students sampled were left-handed)? How does it compare to the assumption that 10% of students are left-handed.
set.seed(86) # replace 999 with the last TWO digits of your student number simulation <-sample(c("Left", "Right"), size=500, prob=c(0.1, 0.9), replace = TRUE) num.of.left <- sum(simulation=="Left")

cat("There are ", num.of.left, " students that are left-handed in the simulation")
## There are 40 students that are left-handed in the simulation
c)
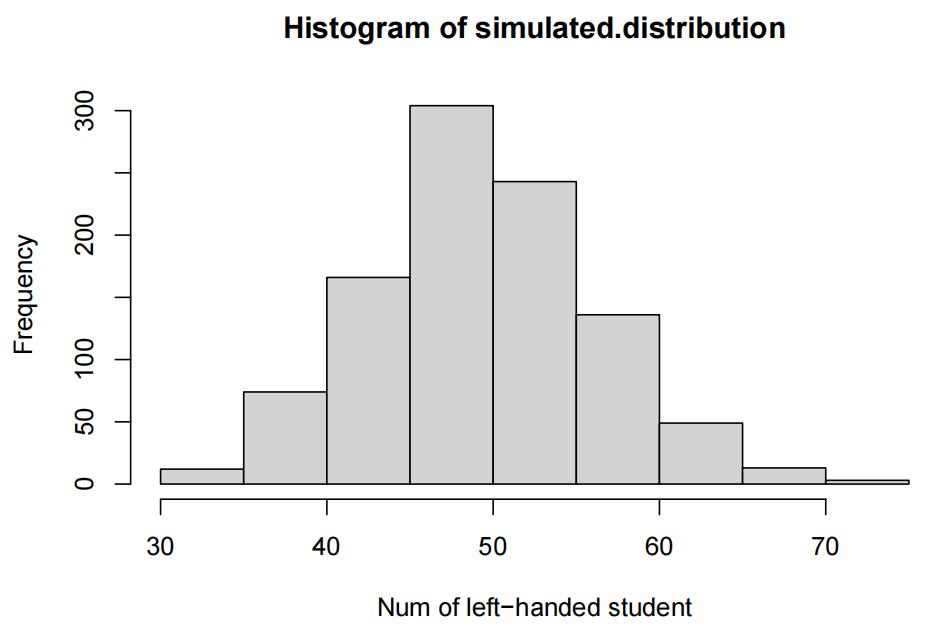
Use R to estimate the sampling distribution of the test statistic under the assumption that the preva-lence of left-handedness among DoSS students matches the general population. Use 1000 repetitions and set the seed to the last 2 digits of your student number. Generate the plot of this estimated sampling distribution and describe the distribution in a few sentences.
Use labs(x=”your title here”) to give the x-axis a better name than the default. You can split your axis title across difffferent lines to make it easier to read by adding \n OR typing an “enter”/carriage return.
set.seed(86)

countLeftHand <- function(size){

  simulation <- sample(c("Left", "Right"), size=size, prob=c(0.1, 0.9),       replace= TRUE )

  sum(simulation=="Left")

}

n<- 1000

simulated.distribution <- rep (0, n)

for (i in 1:n) {

  simulated.distribution[i] <- countLeftHand(500)

}

hist(simulated.distribution, xlab="Num of left-handed student")
d)
Use R to compute the p-value of this hypothesis test based on the sampling distribution that you estimated in part (c).
xbar <- 61

p.value <- sum(simulated.distribution>=xbar)/length(simulated.distribution)

p.value
## [1] 0.065
e) STA130H1F代写
Which of the following statements is/are valid description(s) of the p-value you computed in (d):
i. The probability that the proportion of DoSS students who are left-handed matches the general population.
ii. The probability that the proportion of DoSS students who are left-handed does not match the general population.
iii. The probability of obtaining a number of left-handed students in a sample of 500 students at least as extreme as the result in this study.
iv. The probability of obtaining a number of left-handed students in a sample of 500 students at least as extreme as the result in this study, if the prevelance of left-handedness among all DoSS students matches the general population.
Answer The answer is ii.
f)
Write a conclusion to this hypothesis test based on the p-value you computed in part (d).
Based on the distribution given by 1000 repeated simulations, the p-value of observing 61 left handed people among 500 students is approximately 0. We have strong evidence against H0 and will accept the alternative hypothesis that the proportion of left-handed is difffferent among students.
[Question 2] STA130H1F代写
A Scottish woman noticed that her husband’s scent changed. Six years later he was diagnosed with Parkin-son’s disease. His wife joined a Parkinson’s charity and noticed that odour from other people. She mentioned this to researchers who decided to test her abilities. They recruited 6 people with Parkinson’s disease and 6 people without the disease. Each of the recruits wore a t-shirt for a day, and the woman was asked to smell the t-shirts (in random order) and determine which shirts were worn by someone with Parkinson’s disease. She was correct for 11 of the 12 t-shirts! You can read about this here.
a)
Without conducting a simulation, describe what you would expect the sampling distribution of the proportion of correct guesses about the 12 shirts to look like if someone was just guessing.
If someone is simply guessing, then his/her guesses will be right about half the time. So H0 : µ0 = 0.5 and HA : µ0 = 0.5.
b) STA130H1F代写
Carry out a test using simulation to determine if there is evidence that this woman has some ability to identify Parkinson’s disease by smell, or if she was a lucky guesser.
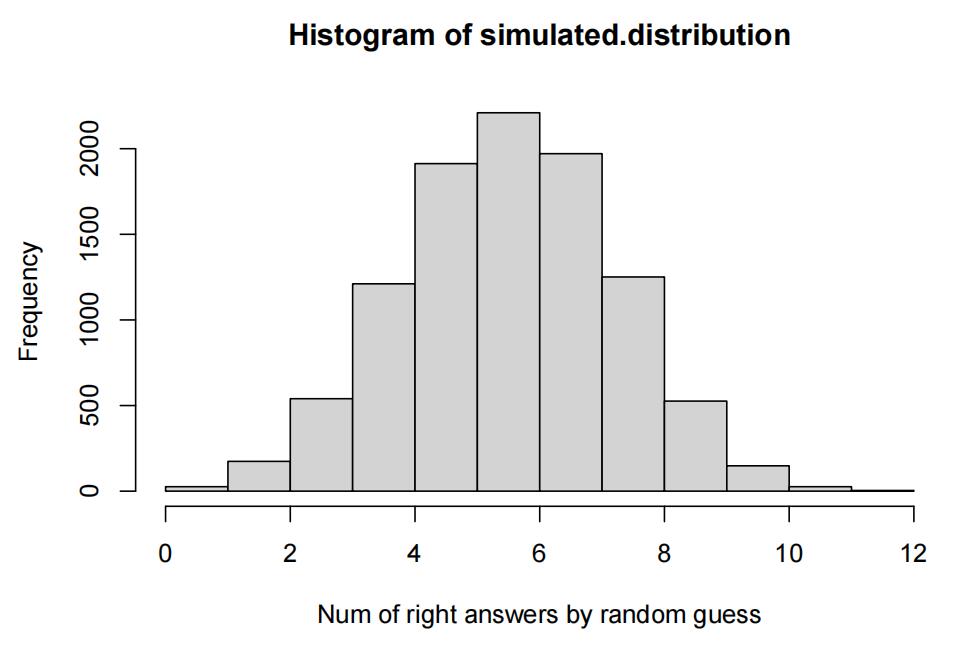
Set the random number seed to the last two digits of your student number before carrying out your simulation. Use 10,000 repetitions. (This simulation is similar to the code in Question 1, but with many more simulated values of the test statistic under the null hypothesis. 10,000 is a lot of repetitions – more that is likely needed – but we’ll do this many repetitions this time anyways.)
set.seed(86)

countCorrect <- function(size){
  real.answer <- sample(c(TRUE, FALSE), size=12, prob=c(0.5,       0.5),replace=TRUE)
  simulation <- sample(c(TRUE, FALSE), size=12, prob=c(0.5, 0.5), replace = TRUE)
  sum(simulation==real.answer)
}

n<- 10000

simulated.distribution <- rep(0, n)

for (i in 1:n) {
  simulated.distribution[i] <- countCorrect()
}

hist(simulated.distribution, xlab="Num of right answers by random guess")
xbar <- 11

mu <- mean(simulated.distribution)
sigma <- sd(simulated.distribution)

p.value <- sum(simulated.distribution>=xbar)/length(simulated.distribution)

cat("The p-value of the hypothesis test is ", p.value)
## The p-value of the hypothesis test is 0.003
Given the p-value = 0.003, we have strong evidence against the null hypothesis that the woman guessed randomly. So the woman had the ability to detect Parkinson’s.
c)
The woman correctly identifified all 6 people who had been diagnosed with Parkinson’s but incorrectly identifified one of the others as having Parkinson’s. Eight months later he was was diagnosed with the disease. So the woman was actually correct 12 out of 12 times. Are you able to get the p-value for the test using this new data, without running a new simulation? What would you change from your answer to (b)? What wouldn’t you change?
new.p.value <- sum(simulated.distribution>=12)/length(simulated.distribution)

new.p.value
## [1] 4e-04
We can approximate the new p-value to be 0.0004. However to be more accurate we need to change the simulation process, and sample the Parkinson’s with higher probability to account for the fact that the chance of Parkinson’s was 7/12 instead of 6/12.
[Question 3] STA130H1F代写
A 1920s tea party
British statistician Ronald Fisher was at a tea party in the 1920s. One of the other guests was algae scientist Dr Muriel Bristol, who refused a cup of tea from Fisher because he put milk in BEFORE pouring the tea Bristol was convinced she could taste the difffference, and much preferred the taste of tea where the milk was poured in afterwards. Fisher didn’t think that there could be a difffference and proposed they test this.
The test was set up as follows: 8 cups of tea were made, 4 with milk in fifirst and 4 with tea in first.
The result: Bristol correctly identified whether the tea or milk was poured first for all 8 cups.
Fisher, being a Statistician, wondered if this happened just by chance (i.e. if Bristol was just guessing, 50/50), OR if it seemed more likely that Bristol was not guessing.
Your turn
Suppose you run an experiment like this with students in STA130. You get a random sample of 50 STA130 students to each taste one British-style cup of tea and tell you whether they think the milk or tea was poured first. 31 students correctly state which was poured fifirst. Go through the steps to test whether students are just guessing or not.
a) STA130H1F代写
What are appropriate null and alternative hypothesis to test the claim? Make sure you defifine the parameter in context.
The null hypothesis is that people will not be able to tell the difffference, so the proportion of being correct will be 0.5.
H0 : µ0 = 0.5
And the alternative test is: HA : µ0 > 0.5
b)
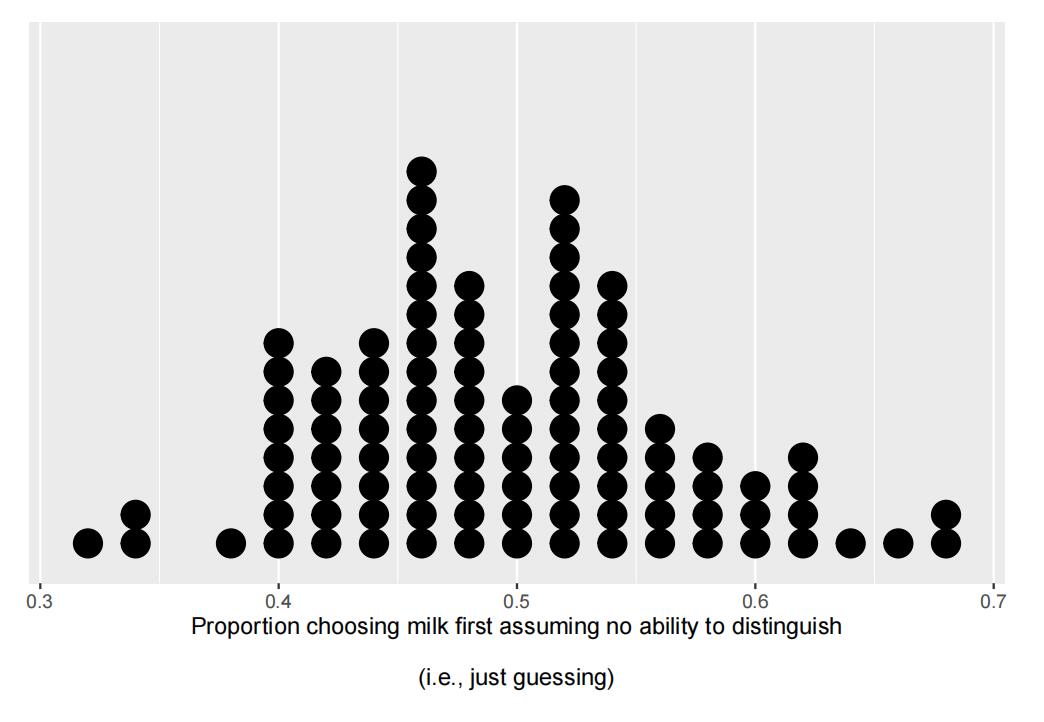
Assume you conduct a test of signifificance using simulation and get the following estimated sampling distribution of the test statistic, assuming the null hypothesis is true. For simplicity, this distribution shows the results of only 100 simulations. There are 100 dots on the plot, one for each simulation. (In practice, 100 simulations is not suffiffifficient to obtain a good estimate of the sampling distribution.)
ggplot(sim, aes(p_correct)) +

  geom_dotplot() +

  labs(x="Proportion choosing milk first assuming no ability to                            distinguish
        \n(i.e., just guessing)") +

scale_y_continuous(NULL, breaks = NULL) # get rid of strange y-axis label
i. What does each single dot in the plot represent?
The single dot in the plot represents a run of simulation, which includes having 50 students to drink tea and take a guess, then the proportion of student who guessed correctly will be this single data point
ii. Based onthis plot, what is your estimate of the p-value?
xbar = 31/50

p.value = sum(sim>=xbar) / repetitions

p.value
## [1] 0.08
My estimate of the p-value is 0.08.
c)
Whatconclusion can you make based on the p-value you calculated in part b(ii)?
With the confidence level of 0.05, we will fail to reject the null hypothesis that normal people can tell the difference in taste.
d)
Suppose the analysis described in (b) is repeated but this time 1000 simulations are used to get a better estimate of the p-value, and the resulting p-value is 0.064. Do not conduct this simulation. What is an appropriate conclusion based on this p-value?
The p-value is still above 0.05, so we will fail to reject the null hypothesis again. We will accept the null hypothesis that normal people can not tell the difffference in taste
You may enjoy this article that provides more details about the tea party and the experiment. Optional.
Part 2 STA130H1F代写
Your peers just fifinished participating in your British Tea experiment and had so much fun that they want you to come up with another one! Your task is to come up with a hypothesis that you could test using a simulation test. You should do the following:
- Writethe hypothesis out in plain words,
- Writethe hypothesis using appropriate scientific/mathematical notation (e.g. Ho = 0),
- Preparea small methods section that explains what the simulation test you will undertake to answer your question is doing for a lay audience,
- Includeat least 2 vocabulary words from this week and explain what they mean for a non-technical audience.
Note: At this point we have only learned how to do hypothesis tests for one proportion. Keep that in mind with your design.
Some things to keep in mind STA130H1F代写
- Try to not spend more than 20 minutes on the prompt.
- Aim for more than 200 but less than 500 words.
- Use full sentences.
- Grammar is not the main focus of the assessment, but it is important that you communicate in a clear and professional manner (i.e., no slang or emojis should appear).
- Be specifific. A good principle when responding to a writing prompt in STA130 is to assume that your audience is not aware of the subject matter (or in this case has not read the prompt).
Vocabulary
- statisticalinference
- population
- randomsample
- samplingdistribution
- simulation
- parameter
- simulationstatistic
- teststatistic
- p-value
Answer:
I would like to verify the effffectiveness of remote lecturing. To do this I will ask 20 students from the same class to submit an essay or an answer sheet to questions, 10 of them took classes online, and 10 of them took classes in person. Then I will ask my peers to judge who took classes online or in person.
The hypothesis is that the learning quality from remote lecturing or participate in person will be indifffferent. So normal people will not be able to tell. Let µ0 denote the proportion of correct answers my peers guessed. The null hypothesis is that H0 : µ0 = 0.5.
Now I will simulate the peer’s guesses by random assignment with probability of 0.5. With adequate amount of repetitions, I will obtain the distribution of number of correct guesses. Then I can calculate the p-value given the observed number of correct guesses. The simulation was to simulate answers given by hypothetical students who really can not tell the difffference.
Note that people may ask what the p-value I calculated was, I will explain as follow: the p-value is the probability of what we observed happened (for example people was capable of identifying 16/20 samples correctly), assuming they actually can not tell the difffference. So if the p-value is low, that means our null hypothesis should be rejected.

其他代写:code代写 assembly代写 CS代写 Data Analysis代写 data代写 essay代写 北美代写 北美作业代写 homework代写 Exercise代写 course代写 作业代写 作业加急 澳大利亚代写 英国代写 加拿大代写 assignment代写 analysis代写
合作平台:essay代写 论文代写 写手招聘 英国留学生代写
