SAS # homework 3
This assignment will explore the reactions of returns to another event: the inclusion of firms in the S&P500 index. You will use as event date the effective date of the inclusion in the index. It happens that firms enjoy abnormal returns (that is, their value increase) once they are added to the index. That is, somehow the inclusion of the firm in the index, a decision that is outside the realm of the firm’s scope, is to be considered good news. The initial explanation for abnormal returns around the inclusion in the index had to do with price pressure from index funds, as these funds have to add a firm to their portfolio once the firm enters the S&P 500, but has since then evolved to many different reasons, e.g., improved liquidity, improved operating performance, and increased investor awareness.
- (3 points) I have collected for you a sample of inclusions in the S&P500 index between 2002 and 2017. The file, SP500_additions.csv (available on Canvas), contains the following variables: TICKER (the ticker of the company) and EFFDATE (the effective date of the inclusion in the S&P500). Import this dataset into your SAS environment. One way to do this (feel free to use yourown method if you prefer) is by reading the CSV into a SAS dataset called d0.
Next, you will need to find the corresponding PERMNO for each stock and bring it in (you can do this by going to WRDS and downloading a dataset that contains both the ticker and the permno for the firms). Once you have that information, bring it into d0 to obtain a new dataset, call it d. Then, you will have to download stock returns for the whole sample period (from 01JAN2002 to 31DEC2017), but you do not need to download returns for stocks that are not part of the sample of inclusions in the index. That is, since you need returns only for the included firms you will need to upload the inclusions file into the WRDS server. Use the PROC UPLOAD, which as the name implies, does exactly the reverse of the PROC DOWNLOAD we already know. So, you will need to run a code like this on the WRDS cloud:
proc upload data=d; run;
Remember to define your worklib in UNIX by referring to your home directory.
- (2 points) Finally, download stock returns and market returns data from UNIX to your local folder. Use a period that encompasses all the dates in your input file (see the dates above). Remember the cloud locations for thesedatasets:
libname crspsd ‘/wrds/crsp/sasdata/a_stock‘; libname crspix ‘/wrds/crsp/sasdata/a_indexes’;
You may want to name the new datasets other than returns and market_returns to not overwrite the datasets that we used in class. For instance, you can name them HWreturns and HWmarket_returns.
- (3 points) Now you have your event date clearly defined. The event is the effective day of inclusion in the S&P 500, EFFDATE. Compute average abnormal returns for the firms included inthe index around these You should fill a table similar to the one shown in class. Do it for event days (-10, 10). For this purpose, you may want to start your initial search using the window (-25, 25). The table should look like this: 1st column should be the relative day, 2nd column should be the average abnormal return, 3rd should be the t-statistic, and 4th should be the number of observations.
(This step is very similar to what we did in class for the event study on earnings announcement. That is, we need to match the datasets, then compute abnormal returns, then average the abnormal returns according to the nature of the subsample. Use the code we discussed in class as a starting point for your analysis.)
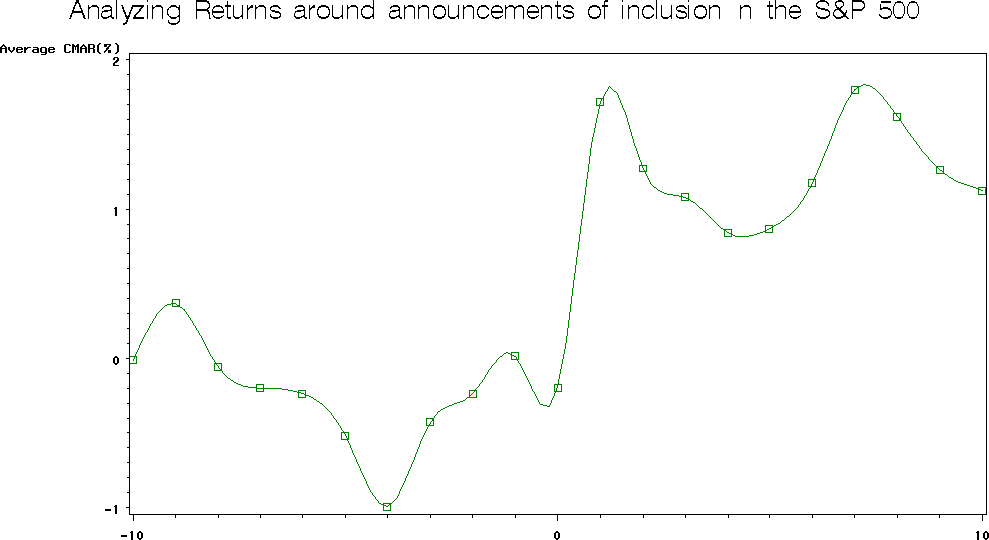
- (2 points) Plot a graph of the average cumulative abnormal return around the index inclusion date. Interpret your figure with the results you had for part
Important: you are graphing cumulative abnormal returns, not the abnormal returns. A suggestion of the format of your graph (though not exactly its shape) is shown below: