SAS # homework 1
- CLM,Chapter 1 page 21, shows some univariate statistics for returns on some indices and stocks:
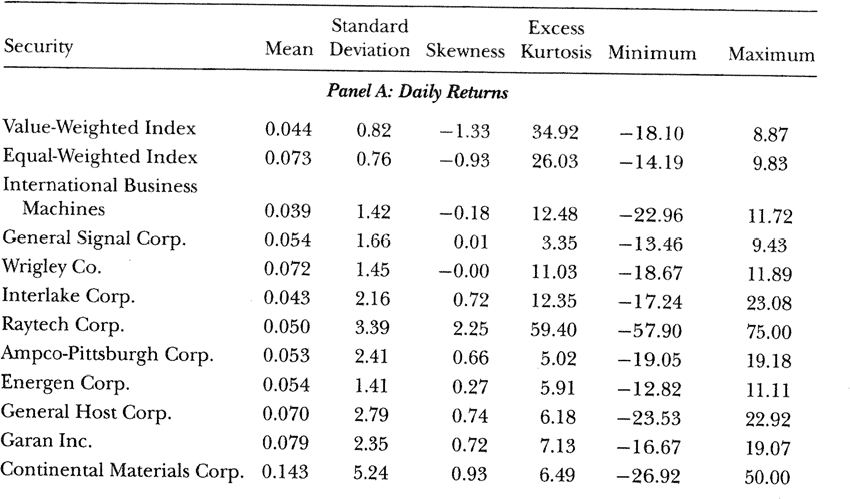
Let’s replicate (part of) this table. Use the codes developed in class as a starting point to write your own code. All you will need is to modify the code a bit here and there (for example, file locations in the LIBNAME specification).
- (2 points) Find in Canvas (in the Files folder, under Week1) a SAS dataset called ‘a1_data_stocks’, with return data for each of the following 3 stocks: General Signal Corp. (permno 12095), Wrigley Corp. (permno 15472) and Interlake Corp. (permno 15747). The time period is from July 3, 1962 to December 30,
Use the univariate procedure to obtain mean, standard deviation, skewness, kurtosis, minimum and maximum value for the returns on each of these stocks. Compare the results with the table above (results may vary a bit, at least because there have been corrections in the data through time). Your answer should include the PROC UNIVARIATE output for the 3 stocks. Tell me if you see any major differences between your output and the above table from CLM.
Assignment 1
(Notice that your dataset has data on 3 different stocks. If you simply use the PROC univariate, you will be mixing data on all these stocks. To get univariate data on each stock, you may want to use the BY condition.)
- Now repeat a) for stock market indices. These are the equal-weighted and value-weighted market returns that I downloaded for you from wrds. They are stored in the variables ‘vwretd’ and ‘ewretd’ in the dataset called ‘a1_data_indices’ also available in Canvas. Again, your answer should include the PROC UNIVARIATE
First time you meet this dataset? Use PROC CONTENTS to understand its variables.
- Wediscussed in class the concept of excess Let’s define excess returns with respect to market returns, that is, returns in excess of what one would obtain if he had invested in the market portfolio. If we define Rit as the return on a stock i and Rmt the return on the market porfolio, then this excess return is:
Zit =Rit – Rmt
- (2points) You need to merge the returns on Interlake and the value-weighted index. The merge needs to match returns on Interlake Corp. and returns on the value-weighted index on a day-by- day basis.
Remember that PROC MERGE requires the merged datasets to have the same field name as the merge key.
- Computethe excess return for Interlake (in excess of the value-weighted market return). It is always good to check whether the code is really doing what is supposed to do. So, print the first 10 observations of your dataset after you compute the excess return. Verify the results of the ‘print’ procedure to make sure your definition of excess returns works as planned. That is, print the variables Zit, Rit, and Rmt, check that Zit is being properly computed. Include the printout in your answer.
- Compute univariate statistics for the excess returns and include the printout in your answer.What happens with the basic statistics (mean, standard deviation, skewness and kurtosis) for this new definition of return? Do you see any changes?
