
Assignment #2
Student Name:
Student ID:
Course Number: MAST 333 & MATH 637
MAST 333 & MATH 637代写 Below is a subset of the class’ data on hours they study per week,and number of credits they are taking this semester.
1.) Below is a subset of the class’ data on hours they study per week, MAST 333 & MATH 637代写
and number of credits they are taking this semester. Calculate the correlation coefficient. (4 points)
| Credits | Study hours |
| 12.5 | 24 |
| 12 | 15 |
| 12 | 15 |
| 13 | 25 MAST 333 & MATH 637代写 |
| 12 | 15 |
| 12 | 25 |
| 12 | 15 |
| 6 | 42 |
| 9 | 25 |
| 15 | 4 MAST 333 & MATH 637代写 |
| 12 | 30 |
| 12 | 15 |
| 12 | 4 |
| 15 | 14 |
| 15 | 20 |
| 15 | 20 |
| 12 | 8 |
| 3 | 2 |
| 12 | 15 |
Ans: Based on formula ,
I set X = hours they study per week, Y = number of credits and then I calculate the correlation coefficient as follows:
Mean of X = 17.526, Mean of Y = 11.763, Mean of XY = 203.263 Mean of X^2 = 397.947, Mean of Y^2 = 146.908 MAST 333 & MATH 637代写
The correlation coefficient = (203.263-17.526*11.763) / [(397.947-17.526^2)*( 146.908- 11.763^2)]^(1/2) = -0.10424
2a.) Interpret the correlation coefficient from Question 1. (1 point)
From Question 1, I can interpret the correlation coefficient as: The hours they study per week and the number of credits are negatively correlated. if hours study per week increases, the credit they get decreases. But the correlation coefficient is only -0.10424, so the negative relationship is not strong.
2b.) What is the predicted number of study hours for a person who is registered in 10 credits? (2 points)
As we calculate in question 1, the standard deviation of X = 9.7887 and the standard deviation of Y = 3.001705, so the beta for the regression X against Y = the correlation coefficient * the standard deviation of X / the standard deviation of Y = -0.10424 * 9.7887/3.001705 = -0.33993, and the intercept of the regression = Mean of X – beta * Mean of Y,
so the intercept = 17.52632 – (-0.33993*11.76316) = 21.52499. Therefore, the regression for the X against Y is: X (study hours) = -0.33993 * Y (credits) + 21.52499, the we substitute Y with 10, we can get expected X = 18.12567
2b.) Which observation from Question 1 do you suspect may be an outlier, and why? (this is a theoretical question and no calculation is necessary here, but you are free to do the calculation if it helps you) (1 point)
I highly suspect the observation with credit = 6 but study hours = 42. If we use the regression in the question 2a, the expected study hours = 6 * -0.33993 + 21.52499 = 19.4854, which is much smaller than 42.
2c.) Plot the data on a scatterplot. From this scatterplot, are there any data points that seem unusual (i.e., may be an outlier), and why? (Note that your answers to 2b and 2c do not have to be the same). (2 points)
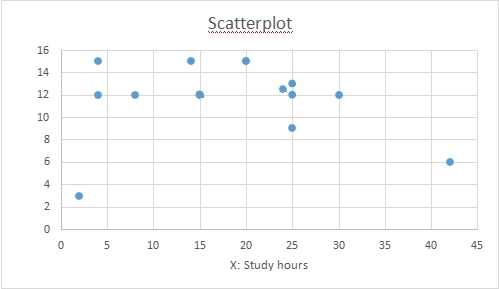
Based on this scatterplot, it seems that the data point in the lower right corner and lower left corner are unusual since they are far away from the other data groups. MAST 333 & MATH 637代写
3a) The distribution of IQ scores for CEGEP graduates is normally distributed with ![]() = 104 and
= 104 and ![]() = 16. Find the probability a person chosen at random from this group has an IQ score above 146. (2 points)
= 16. Find the probability a person chosen at random from this group has an IQ score above 146. (2 points)
I set the IQ score as X, so the question is asking what is the probability that a person chosen at random from this group has X>146. Prob(X>146) = 1 – prob(X<=146)
And prob(X<=146) = prob( (X-104)/16 <= (146-104)/16)). Then I set Y = (X-104)/16, and Y is standard normal distributed. Therefore, prob(Y<=2.625) = 0.995668,so the prob(Y>2.625) = 1-0.995668 = 0.004332 = Prob(X>146)
3b) From the information in 3a, what IQ score is the 95th percentile of this normal distribution? (2 points)
The 95th percentile of this normal distribution = 104 + 16*1.645 = 130.317658

4) A television set manufacturer has found the length of time until the first repair is normally distributed, MAST 333 & MATH 637代写
with a mean of 4.5 years and a standard deviation of 1.5 years. If the manufacturer wants only 10.2% of the first repairs to occur within the warranty period, how long should the warranty be? (2 points)
In this case, I need to get the left 10.2% quantile which is -1.27024 So the warranty period = -1.27024*1.5 + 4.5 = 2.594644 years
5a) Do Americans tend to vote for the taller of the two candidates in a presidential election? In 30 presidential elections since 1856, 18 of the winners were taller than their opponents.
Assume that Americans are not biased by a candidate’s height and that the winner is just as likely to be taller or shorter than his opponent. Find the approximate probability of finding 18 or more of the 30 pairs in which the taller candidate wins. (2 points)
I can set the X = finding 18 or more of the 30 pairs in which the taller candidate wins. Prob(X) = C18 *0.5^18*0.5^(30-18) +… +C30 *0.5^30*0.5^(30-30) = 0.18079730 30
5b) Based on your answer in 5a, can you conclude that Americans consider a candidate’s height when casting their ballot? (1 point)
Since the probability that finding 18 or more of the 30 pairs in which the taller candidate wins is only 0.180797, I conclude that Americans do not consider a candidate’s height when casting their ballot
6) In a learning experiment, untrained mice are placed in a maze and the time required for each mouse to exit the maze is recorded.
The average time for untrained mice to exit the maze is m = 50 seconds and the standard deviation of their times is s = 16 seconds. Suppose that a sample of 64 randomly selected untrained mice are placed in the maze and the time necessary to exit the maze is recorded for each. What is the probability that the sample mean differs from the population mean by more than 3?(2 points)
I can calculate the Z-value to answer this question and I set sample mean as X hat and population mean as X bar.
In this case, the sample standard deviation = population standard deviation / n^(1/2) = 16/8=2 Prob(X hat lower than X bar by more than 3) = Prob( X hat – X bar<-3) =
Prob((X hat – X bar)/sample standard deviation < -3/sample standard deviation) = Prob(Z< -1.5)= 0.066807
Prob(X hat higher than X bar by more than 3) = prob( X hat – X bar>3) = Prob((X hat – X bar)/standard deviation >3/standard deviation) = Prob(Z>1.5) = Prob(Z< -1.5) = 0.066807 MAST 333 & MATH 637代写
Therefore, the probability that the sample mean differs from the population mean by more than 3= 2*0.066807 = 0.133614
7a) A recent nationwide survey by the Canadian Cancer Society found the percentage of women who smoke has increased to 30%.
That seemed a little low for your province, so you sampled 500 women from your province and found that 180 of them smoke. What is the sample proportion of women who smoke in your province?(1 point)
The sample proportion of women who smoke in my province = 180/500 = 36%
7b) What is the probability that at least 36% of women in your province are smokers if the true population proportion p = 0.30?(3 points)MAST 333 & MATH 637代写
The n*p = 500*36% = 180, n*(1-p) = 500*(64%) = 320, since 180 and 320 are all much larger than 10, so I can use the normal approximation here.
, p-hat is the sample proportion, which is 36% in the case.
So the Z-value = (36%-30%)/ [30%*(1-30%)/500]^(1/2) = 2.9277
so the prob(p-hat >=36%) = prob(Z>=2.9277) = 0.001707

其他代写:代写CS C++代写 java代写 matlab代写 物理代写 考试助攻 paper代写 r代写 金融经济统计代写 web代写 app代写 作业代写 数学代写
