Homework 1
Due 9/28
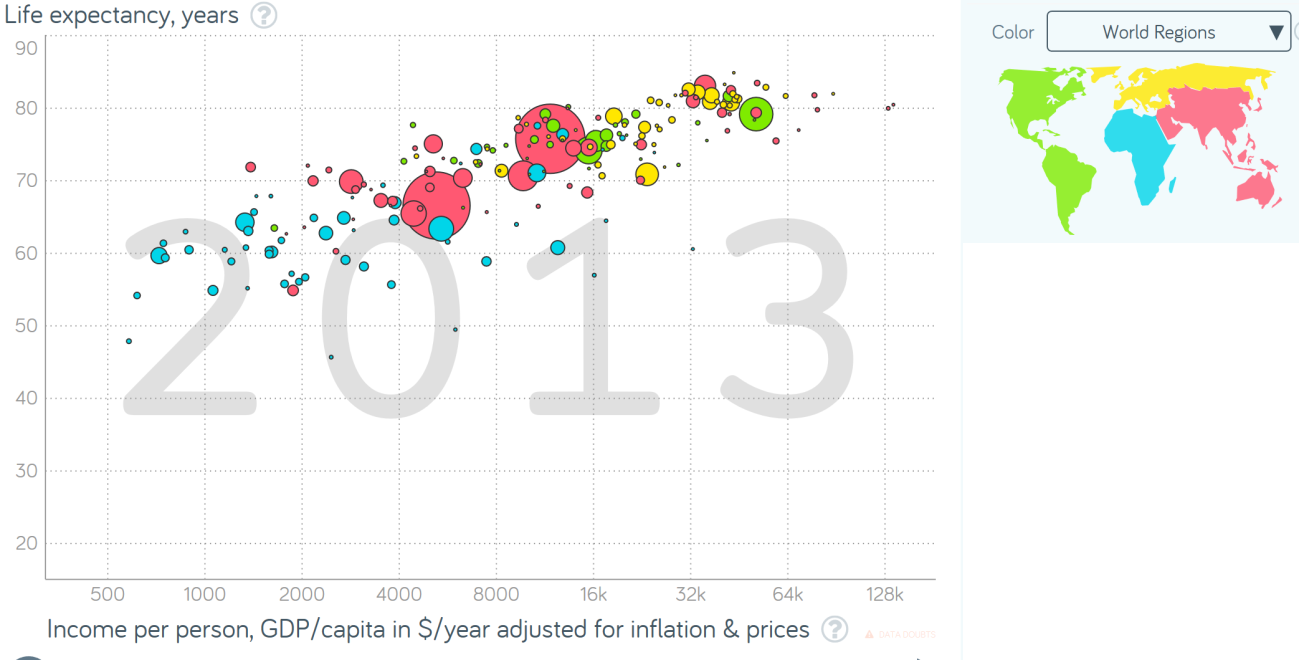
1. Your task is to recreate the graphic from Gapminder, below. The data (countries.Rdata) was collected and modified from The World Bank Databank, and so your recreation may not be the exact data (though I think that’s where they got their data for this, so it should be close). The graphic is also in a PNG file attached to the assignment. The data is packaged neatly in a file called “countries.Rdata”. The variables should be self explanatory given the graph.

-

代写r Homework
The purpose of this replication is to get some practice thinking about details and decisions in graphs. Find the details and try to figure out how to do them, though there will certainly be some differences between the gapminder visualization and your own, so you don’t need things to be perfect detail to detail. For instance, if the colors don’t match up perfectly, no big deal. But obviously color should be a part of the details that you notice and the decisions you ultimately make.
A few more notes:
a) The 2013 doesn’t need to be there.
b) Your color legend probably won’t be a map of the world. It’ll be just a normal legend. The graphs from Gapminder are highly interactive and highly stylized, so some things will need/have to change.
c) For colors, look into the function scale_color_brewer
Homework 1
Due 9/28
2. Using the files Batting.csv and Salary.csv, answer the following: For the time-period of 2000-2010, calculate, for each team, the average of the per-player median yearly salary-per-game over the players career with that team.
You will turn in R code for this question. Important: please load your datasets as: salaries <-read_csv(“Salaries.csv”); batting <- read_csv(“Batting.csv”) so that, when I run your code, I don’t have to constantly re-load the datasets, I only need to run your pipeline.
Your code should consist of a single pipeline. NO saving of variable other than the initial loading of the datasets.
There are three things you will need to do in order to complete this challenge…
a) Parse the sentence…
b) Build your pipeline. Functions to consider (you may not need to use all of them, but to remind you of the ones we went over in class): filter(), mutate(), group_by(), summarize(), ungroup(), arrange(), inner_join(), right_join(), left_join(), anti_join()
c) Deal with oddities of the data that may give you wrong results (like the variable “stint”!! How do you plan to handle this? Make it clear what decision you make) (see variable descriptions below)
The variables in each dataset are:
Batting Table
playerID Player ID code
yearID Year
stint player’s stint (order of appearances within a season) (for instance, a player that switches
teams mid-year will have two stints, with stint=1 indicating the first team, stint=2 the second team)
teamID Team
lgID League
G Games
AB At Bats
R Runs
H Hits
2B Doubles
3B Triples
HR Homeruns
RBI Runs Batted In
SB Stolen Bases
CS Caught Stealing
AB Base on Balls
SOStrikeouts
| IBB | Intentional walks |
| HBP | Hit by pitch |
| SH | Sacrifice hits |
| SF | Sacrifice flies |
| GIDP | Grounded into double plays |
Salaries table
Homework 1
Due 9/28
| yearID | Year |
| teamID | Team |
| lgID | League |
| playerID | Player ID code |
| salary | Salary |
3. For this question, you will use the restaurant data. Your task is to come up with two quality, different visualizations for each of the questions below, followed by a discussion of the relative merits of each visualization, followed by a decision stating which visualization you would choose. The questions are
a. Do consumers rate restaurants whose cuisine is preferred differently than those whose cuisine is not preferred?
b. Open response question: explore the data and tell a story of your own
Again, each question a) and b) should have 2 different visualizations which you will compare and contrast. The files you may find useful are: usercuisine.csv, which specifies the favorite cuisine(s) of each user, userprofile.csv which contains a profile of each use, and chefmozcuisine.csv, which describes the cuisine of each restaurant, and finally rating_final.csv which contains a column for the user, and column for the restaurant, and a column for the rating.
Finally, each visualization should be created from one pipeline (in other words, starting with the uncleaned data to the final plot).
Note that there are several choices you will have to make with regards to the data. You should take some time to really look through the data and understand it in order to make these decisions.
更多关于 r代写 案例
