Statistical Analysis
Statistical Analysis代写 The below figures show the reaction times among different groups and different trails for the adult subjects.

Reaction time
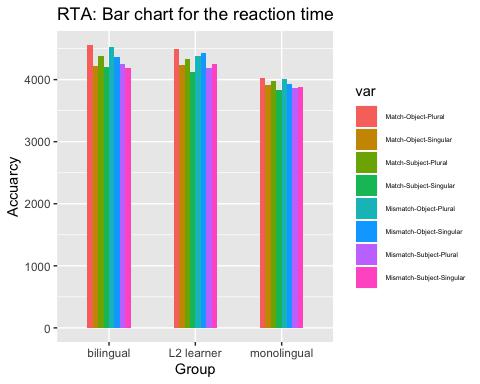
The below figures show the reaction times among different groups and different trails for the adult subjects.
The reaction time is slightly shorter for the monolingual group than the bilingual and L2 learner. The reaction time between bilingual and L2 learner does not differ much. Whether the number is match or not, or whether the first word is plural or singular also seems to be unassociated with the reaction time.Statistical Analysis代写
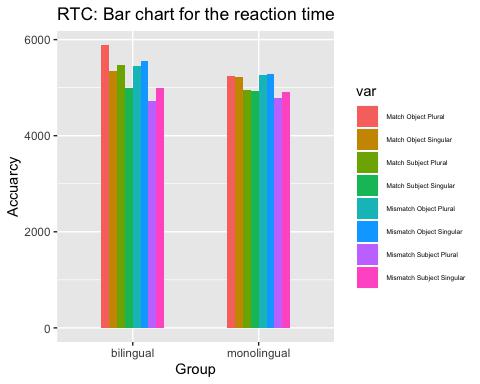
The below figures show the reaction times among different groups and different trails for the child subjects.
Similar results are obtained. The reaction time is slightly shorter for the monolingual group than the bilingual one. For the child group, there is no L2 leaners in the experiment. The reaction times for different number or NP_first variables also seem to be the same.Statistical Analysis代写
For the eight conditions, the summary for adults and children are summarized as follows.
For the reaction time, the linear mixed effect models are applied to the both adult and child subjects.
For the models, the three-way interaction among the group, structure, and FirstNP are considered as the fixed effects. Initially, the four-way interaction is built but cannot converge thus it is reduced to the three-way interaction model. One specifies that there are intercept random effects regarding different subject, item, trail, as well as condition. Both models converge well. The below tables show the summary of the linear mixed effect model for the adult and child subjects, respectively.Statistical Analysis代写
For the factors variables, Object, Match, Plural, are coded as +1 while the others are coded to be 0.
| est | se | stat | p | |
| (Intercept) | 5258.9676 | 163.0040 | 32.2628 | 0.0000 |
| Group | 162.9174 | 148.5225 | 1.0969 | 0.2727 |
| Structure | 269.7284 | 47.8238 | 5.6400 | 0.0000 |
| FirstNP | 36.7909 | 50.5812 | 0.7274 | 0.4670 |
| Group:Structure | 50.3963 | 31.7440 | 1.5876 | 0.1124 |
| Group:FirstNP | 43.9533 | 31.5826 | 1.3917 | 0.1640 |
| Structure:FirstNP | 18.1692 | 49.8604 | 0.3644 | 0.7156 |
| Group:Structure:FirstNP | -0.5681 | 31.5837 | -0.0180 | 0.9856 |
The above tables imply that the effects associated with the reaction time are the same for adult and child. For both adult and children subjects, variable structure is statistically significant while al the others are not.Statistical Analysis代写
Accuracy
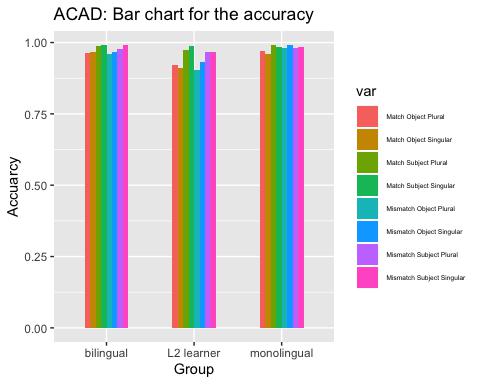
The below figures show the accuracy, in percentage, among different groups and different trails for the adult subjects.
Through the bar charts, one may not conclude that there is significant difference among different group or factors.Statistical Analysis代写
Similarly,
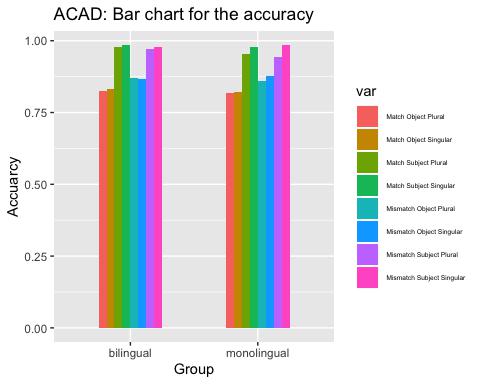
accuracyiesf or the children, in percentage, among different groups and different trails shown via the charts below also do not illustrate that there is significant difference among different group or factors.Statistical Analysis代写
For the accuracy,
the generalized linear mixed effect models with a logistic link function are applied to the both adult and child subjects. For the models, the three-way interaction among the group, structure, and FirstNP are considered as the fixed effects. One specifies that there are intercept random effects regarding different subject, item, trail, as well as condition. Both models converge well. The below tables show the summary of the generalized linear mixed effect model for the adult and child subjects, respectively.Statistical Analysis代写
Still, initially,
the four-way interaction is built but cannot converge thus it is reduced to the three-way interaction model.Statistical Analysis代写
| est | se | stat | p | |
| (Intercept) | 4.2279 | 0.2054 | 20.5799 | 0.0000 |
| Group | 0.0347 | 0.1708 | 0.2029 | 0.8392 |
| Structure | -0.5388 | 0.0798 | -6.7541 | 0.0000 |
| FirstNP | -0.0973 | 0.0785 | -1.2398 | 0.2151 |
| Group:Structure | -0.1501 | 0.0964 | -1.5582 | 0.1192 |
| Group:FirstNP | -0.1114 | 0.0962 | -1.1584 | 0.2467 |
| Structure:FirstNP | 0.0319 | 0.0788 | 0.4053 | 0.6853 |
| Group:Structure:FirstNP | 0.0802 | 0.0962 | 0.8337 | 0.4045 |
| est | se | stat | p | |
| (Intercept) | 3.2025 | 0.1944 | 16.4741 | 0.0000 |
| Group | 0.0956 | 0.1641 | 0.5821 | 0.5605 |
| Structure | -1.0756 | 0.0914 | -11.7697 | 0.0000 |
| First_NP | -0.1892 | 0.0896 | -2.1117 | 0.0347 |
| Group:Structure | -0.0771 | 0.0755 | -1.0214 | 0.3071 |
| Group:First_NP | 0.1068 | 0.0744 | 1.4343 | 0.1515 |
| Structure:First_NP | 0.1603 | 0.0894 | 1.7922 | 0.0731 |
| Group:Structure:First_NP | -0.0904 | 0.0744 | -1.2141 | 0.2247 |
The variable structure are significant to the accuracy for both adults and children.
The variable FirstNP, which is also one of the interests in the project, does not statistically singnficantly associated with the accuracy but yhe interaction of variable FirstNP and structure are slightly significant for child subject.Statistical Analysis代写
The proportion of looks towards the correct picture
For the proportion of looks towards the correct picture, one may demonstrate the ratio across the time for different groups through the below figures.
Through the figures below, it is easy to see that L1 adult have a significant higher ratio while the bilingual and L2 leaner are similar for the adult subjects. For child subject, the bilingual subjects have slightly higher ratio at the beginning but monolingual subjects obtaining higher ratio as time goes on.Statistical Analysis代写
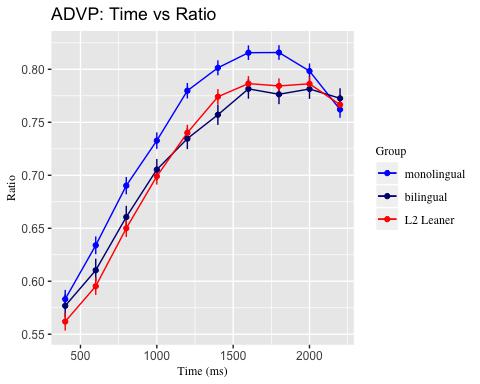
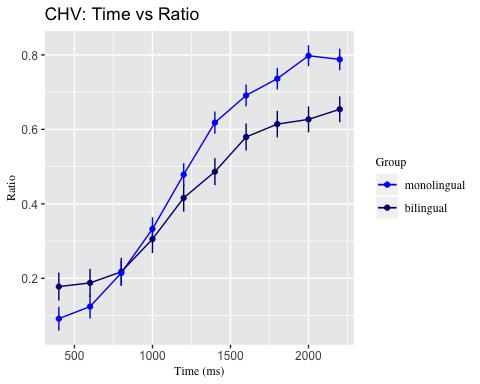
To model the ratio, one transforms the ratio to the variable elong.
Thus the variable elog is treated as the response in the linear mixed effect model. For both adult and children, the two-way interaction between the group and time are modelled as the fixed effects while the subject, item, trail and condition are considered as the random effects.Statistical Analysis代写
The below tables show the summary of the linear mixed effect model for the adult and child subjects, respectively.
| est | se | stat | p | |
| (Intercept) | 0.7375 | 0.0978 | 7.5413 | 0.0000 |
| Group | 0.0070 | 0.0310 | 0.2250 | 0.8220 |
| poly(Time, 1) | 60.8814 | 1.3508 | 45.0692 | 0.0000 |
| Group:poly(Time, 1) | -2.7671 | 1.6967 | -1.6309 | 0.1029 |
| est | se | stat | p | |
| (Intercept) | 0.3950 | 0.1182 | 3.3419 | 0.0008 |
| Group | -0.0543 | 0.0437 | -1.2434 | 0.2137 |
| poly(Bin, 1) | 41.7965 | 1.4125 | 29.5895 | 0.0000 |
| Group:poly(Bin, 1) | -8.5507 | 1.4125 | -6.0537 | 0.0000 |
For both adults and children, time plays the most significant role in the experiments.
But the group factor does not significantly relate to the ratio for the adults. However, for children, the interaction between language group and time is statistically significant. That is, the monolingual children have a faster improvement than the bilingual children as time go on. This result is consistent with the charts shown previously.Statistical Analysis代写
