GGR321
Assignment 1 Model Builder – Part 2
19 Marks
Objectives
In this assignment, you will:
- Convert geospatial data between different
- Create and execute simple scripts using
- Perform basic math and buffering
Part 2-1: Model Builder
Model builder is a set of tools specific to ArcGIS that allows for automating GIS tasks. Instead of writing code, you work with a GUI and connect tools together.
- Open Model Builder by clicking on the
- Add the projected ONMun layer to the model,either:
- Use the add data button,or
- Drag and
- Open ArcToolbox and navigate to the Conversion Tool toolbox. From the To Raster sub- menu, click on Polygon to Raster and add the tool to Model
TIP: You can search for tools by opening the Search Window from the Geoprocessing menu, or press Ctrl + F.
- Once you have added the tool to Model Builder,click
on the connect icon and connect the blue ONMun circle to the Polygon to Raster tool. When you connect the data source to the tool it will open a window that lists the parameters, where that type of file is applicable. In this instance we want to add ONMun as the data source, thus we click on Input Features.
- Double click on the tool and set the followingparameters:
- Value field:MunID
- Cell size:50.
- Save the data to your drive with an appropriate
o If you do not specify a file extension the raster will be saved in the ArcGIS GRID format. Valid file extensions are *.tif (compressionless) (preferred),
*.jpg (can be compressed) (may lose information), *.img (ENVI image) (may not be compatable), etc.
Question 1. [1 Mark] What is the the cell size of your new raster layer?
Important: By default, Model Builder uses the coordinate system of the input data layers. However, it may use the coordinate system of the active data frame. We will get into changing the Environment Settings in a later assignment. You should be aware that the outputs from Model Builder depend on the Environment Settings which can, and often should, be user defined. For the moment, we can use the default settings.
- You have just created a Model or script that runs a simple program. Model Builder canbe used to connect tools into an automated workflow. Automated workflows are great for reducing the time to complete repetative
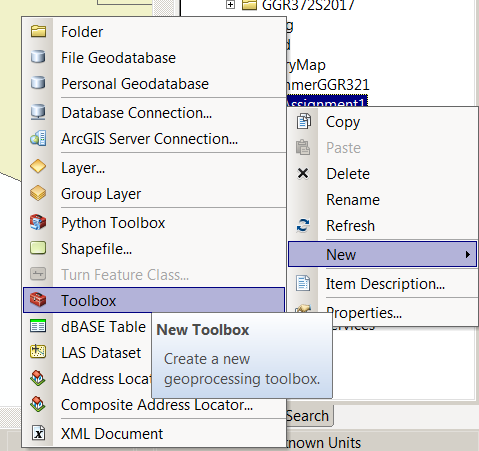
Once you create a model, you can save it inside a toolbox. In ArcCatalog, to create a toolbox, right click in the folder you want to save the toolbox in and select New Toolbox. You can then save the model inside the toolbox.
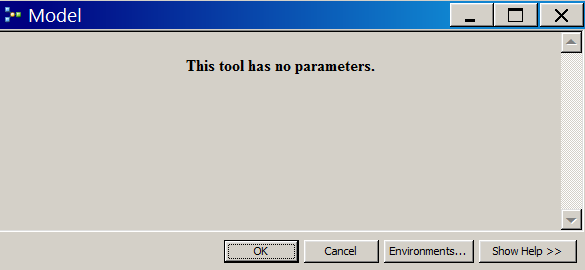
- If you want to make changes to the model you will need to right click on the modeland select Edit. If you attempt to open the model (by double clicking or selecting Open) the model will not open in the editor. It will attempt to “open” or run the
We have not created a model that accepts parameters, so it will run if you click OK. It is easier to open the model in the Model Builder editor and run from there.

Question 2. [2 Marks] Which is the better data model for representing municipal boundaries, raster or vector, and why?
Part 2-2: Raster to Vector
Now let’s convert a raster to a vector. But instead of converting the entire raster, we will
convert a particular city.
- Create a new model. We will select only the raster cells that represent the City of Thunder Bay. Use the Extract by Attributes tool to create a new raster for the city of Thunder
- To select just the city of Thunder bay, we will extract only pixels that havethe MunID of 470 (City of Thunder Bay).
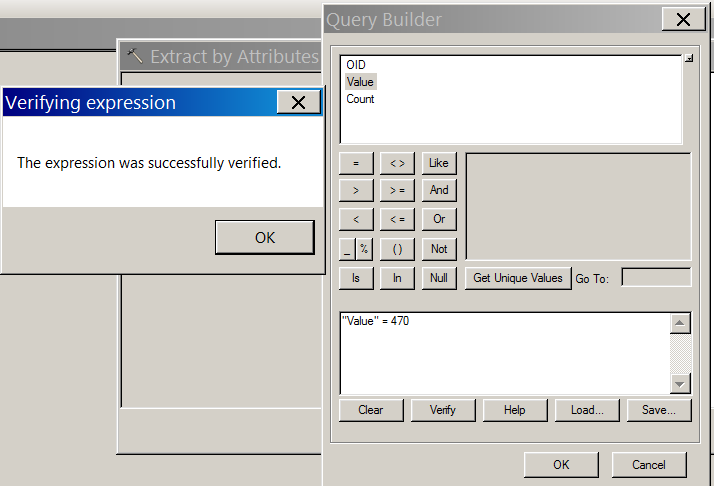
- In the extract by attributes tool, click on the SQL button next to Where Clause. We will define a statement in Structured Query Language (SQL) that will select a subset of the total pixels. Note that when a raster is associated with an attribute table, a list of field names appears in the top of the Query Builder
- Even if a raster does not have an attribute table, you can always select the pixel values using “Value”. In this case, enter into the query builder, “Value” = 470 and click on Verify to make sure the expression is valid. Pay attention to the spaces and quotation marks, as the expression must have the correct

- Add Raster to Polygon tool twice to the
- You will convert the output from the Extract By Attributes tool, twice, to two different shapefiles.
- In the first instance, leave simplified polygon
- In the second instance, convert the Thunder Bay raster with simplified polygon unchecked.
Question 3. [3 marks]. Create a figure showing the differences between the simplified polygon of Thunder Bay and the un-simplified polygon of Thunder Bay.
- Include a figure caption describing which polygon colour represents each
- The figure should be zoomed in sufficiently so that the differences in the boundary are
o You do not need to present the entire geographic region in the figure.
- Include alegend
Question 4. [1 Mark] Include a graphic of your Model Builder that shows the selection of Thunder Bay and the creation of the two vector files.
- To export a graphic, go to Model > Export > To
Part 2-3: Site Selection
- Create a site suitability model in Model Builder to determine the areas where agriculture can be practiced according to two constraints, slope and proximity to a
- An agricultural policy in a region requires that there is no agriculture on slopes greater than5%.
- Vehicular resources in this area are very restricted, farmers would need to bring their crops to the road by cart or horse. Thus, only areas within 500 meters of a road are suitable.
- Using the DEM and road layers, find areas where the slope is less than 5% andare within 500 meters of a
- The DEM file is provided in the Geographic Coordinate System: WGS
- The Road file is provided in the Geographic Coordinate System: NAD 1983(CSRS).
- The .prj file is not provided with your data. You will need to define theprojection.
Question 5. [12 marks] Create a figure showing the suitable agricultural land (binary 1 = Yes). Include a copy of your Model Builder.
- This section requires problem solving and some independent learning to identify the procedure necessary to achieve the final
- All Analysis should be conducted on files that are projected to: NAD 1983 UTMZone 16N.
- Your figure should cover the entire area of the DEM (Hint: Set Processing Extent in ModelBuilder).
Useful tools:
- Con Tool (Conditional Tool Box) in Spatial Analyst
- Performs a conditional if/else evaluation on each of the input cells of an input raster.
- Euclidean Distance in Spatial AnalystTools
- Calculates, for each cell, the Euclidean distance to the source
Binary Raster, a raster where Values of 1 = Yes (i.e. Yes it is within 500 m of a road), 0 = No.
[Important] Assignment Submission Requirements:- Assignments have to be submitted in the format of MicrosoftWord.
- Use Times New Roman 12-point font. Line spacing:5.
- Don’t forget to put the title of the assignment, your official name, and your student ID # on the top of first
- Please combine all your answers for part 1 and part 2 together into one single file, and submit your assignment through Quercus by the due date (Sep 27, 2019 at 5:00pm).

