Bayesian Data Science: Assignment 2
Instructions:
· Please do all questions and parts
· Please show all relevant working and use R for all statistical programming and analysis. This assignment will cover a portion of part 2 of the course: Chapters 6-13 “Doing Bayesian Data Analysis”, second edition by JK. The third assignment will also cover a portion of part 2. This assignment will be graded on 100 points. This second part of the course is very important because it …
… covers all the crucial ideas of modern Bayesian data analysis while
using the simplest possible type of data, namely dichotomous data such as agree/disagree,
remember/forget, male/female, etc. Because the data are so simplistic, the focus can be
on Bayesian techniques. In particular, the modern techniques of “Markov chain Monte
Carlo” (MCMC) are explained thoroughly and intuitively. Because the data are kept
simple in this part of the book, intuitions about the meaning of hierarchical models
can be developed in glorious graphic detail. This second part of the book also explores
methods for planning how much data will be needed to achieve a desired degree of
precision in the conclusions, broadly known as “power analysis.”
· Use “R Mark down” to construct your assignment answers. Use appropriate Latex formulae
( https://en.wikibooks.org/wiki/LaTeX/Mathematics ) and r code chunks.
o Please submit your Rmd document, html and pdf knit documents.
o See http://rmarkdown.rstudio.com/index.html for help with rmarkdown
o Make sure all of the files pertaining to the assignment are in the same directory.
o I will run your Rmd document and check that your code works.
o The functions you make must have arguments suitable to solve the problem and produce the desired output. It is up to YOU to determine what arguments are needed.
o You may use base R functions and/or other packages like ggplot2
o Make sure your name is on the titles of all plots you make.
o You may consult google, youtube etc for help on R,ggplot2, JAGS etc
o All plots should be large (at least ¼ a page)
· This assignment assumes that you have already installed the following software (all of which are free)
o R
o R Studio
o Latex (best to have a full distribution)
o Jags
· Your finished assignment should be readable and intelligible.
· You are expected to do ALL questions and parts!!!
o For those who did not do them all please give a list of all questions and parts you DID NOT DO!! This will be the last thing you do before uploading the documents.
o If you did all questions and parts please say : “All questions and parts done completely”
Questions:
1. The following will require a derivation and R functions:
a. Write down Bayes’ theorem
b. Derive the general posterior result for a Beta prior and Binomial likelihood. (Show all working)
c. Plot the three graphs on one interface using R and use the experimental results n=10, x=4 with a uniform prior.
d. Make a function that will create a similar plot but for different alpha, beta, n and x. Call the function mybeta()
e. Give the ouput of the function when the following is submitted:
i. Mybeta(alpha = 2, beta=2, n=10, x=6)
ii. Mybeta(alpha = 4, beta=2, n=10, x=6)
iii. Mybeta(alpha = 2, beta=4, n=10, x=6)
iv. Mybeta(alpha = 20, beta=20, n=10, x=6)
f. Now make a new function (mybeta2()) that will produce the same plots as mybeta() but will release command line Bayesian point estimates and BCI’s of whatever equal tail size we wish – all estimating “p”. The command line output will be a list containing these estimates (all appropriately labelled). Give the ouputs of:
i. Mybeta2(alpha = 2, beta=2, n=10, x=4, alphalevel=0.05)
ii. Mybeta2(alpha = 2, beta=2, n=10, x=4, alphalevel=0.10)
iii. Mybeta2(alpha = 2, beta=2, n=10, x=3, alphalevel=0.05)
iv. Mybeta2(alpha = 2, beta=2, n=10, x=3, alphalevel=0.01)
2. A prior used to summarize belief about “p” can often be well approximated by a Beta distribution with appropriate choice of hyper-parameters alpha and beta. This will not always be the case. Sometimes a mixture of betas will do a better job. A mixture of beta densities can be expressed in the following way ![]() where w is the mixing weight and is a number between 0 and 1.
where w is the mixing weight and is a number between 0 and 1.
a. Show that mixbeta satisfies the first 2/3 properties of a density. The three properties are:

b. Make an R function that will create the mixture density using ![]() as described above. Call it mymix().
as described above. Call it mymix().
c. Make a function that will plot the mixture – call it mymixplot(). Show the output when the following are submitted:
i. Mymixplot(w=0.3, a1=2,b1=4,a2=4,b2=2)
ii. Mymixplot(w=0.5, a1=2,b1=4,a2=4,b2=2)
iii. Mymixplot(w=0.7, a1=2,b1=4,a2=4,b2=2)
iv. Mymixplot(w=0.9, a1=2,b1=4,a2=4,b2=2)
d. Using the ![]() prior and a single Binomial (x successes in n trials)
prior and a single Binomial (x successes in n trials)
i. Find the analytical posterior – that is do the algebra and show that the posterior is a mixture also.
ii. What is the posterior mixing weight?
iii. Plot the prior, likelihood and posterior on the same set of axes when w = 0.5, n=10, x =4, a1 =a2=2,b1=b2=4
3. The following problem relates to the above notions of mixtures. Suppose a coin is either “unbiased” or “biased”. In which case the chance of a “head” is unknown and is given a uniform prior distribution. We assess a prior probability of 0.9 that it is “unbiased”, and then observe 15 heads out of 20 tosses.
The model written in JAGS is given below:
modelString = "
model {
    x ~ dbin( p, n )
    p <- theta[pick]
    pick ~ dcat(q[]) # categorical 1 produced prob q[1], etc
    # pick is 2 if biased 1 unbiased
    q[1]<-0.9
    q[2]<-0.1
    theta[1] <-0.5 # unbiased
    theta[2] ~ dunif(0,1) # biased
    biased <- pick - 1
}
" # close quote for modelString
a. Explain how the JAGS distribution function dcat() works.
b. Take the above model and use it within JK’s code “Jags-ExampleScript.R” adjusting it so that it will create an MCMC sample from the posterior. The two parameters you must monitor are “theta[2]” and “biased” (note: you do not need the inits function – just use something like: initsList = list( pick = 1)) – do NOT attempt to plot the “biased” parameter yet – ONLY “theta[2]”.
c. Once you have it working place the script within the body of a function – say mypriormix(), you can then call the script by simply calling the function (no options are needed).
d. Show the MCMC diagnostics and the posterior sample histograms for theta[2].
e. Show the summary information of the posterior sample – what is the sample called in the script? Hint: Use summary(); su = summary(…); su$statistics
f. What is the posterior probability that the coin is biased?
4. We will work on the same model as in question 3. This time we will examine the model in light of the theory covered in section 10.3.2.1 page 279 and following. The first thing we will need to do is manipulate the list of data created by the JAGS sampler. Locate the mcmc data which will be in the form of a list.
a. Give the structure of the MCMC data in the file produced by the jags script you made in qu. 3 hint: str(…)
b. Use the following code to make mcmcT by filling in the correct object name …
mcmc1 = as.data.frame(…[[1]])
mcmc2 = as.data.frame(…[[2]])
mcmc3 = as.data.frame(…[[3]])

mcmcT = rbind.data.frame(mcmc1,mcmc2,mcmc3)
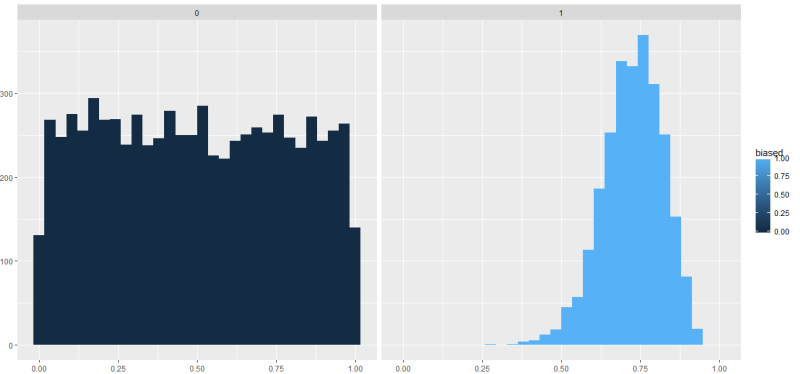
c. Using mcmcT and the ggplot2 R package make the following plot after first understanding precisely the pseudo prior method. Make sure you have YOUR name on it!! Colors don’t have to precisely correspond. Hint: You will need the option fill = …, facet_wrap(), aes(x = `theta[2]`)

d. Looking at the picture above and considering the model, answer the following:
i. When the parameter biased = 0:pick = ?,
ii. when biased = 1: pick = ?
e. The three variables updated in the Gibbs sampler will go in alphabetical order pick, theta[1] and then theta[2] and then cycling around again and again … .
i. When pick = 1, theta[1] will be sampled from the posterior, then theta[2] will be sampled from what?
ii. When pick = 2 what will theta[1] be sampled from?
iii. When pick = 2 what will theta[2] be sampled from?
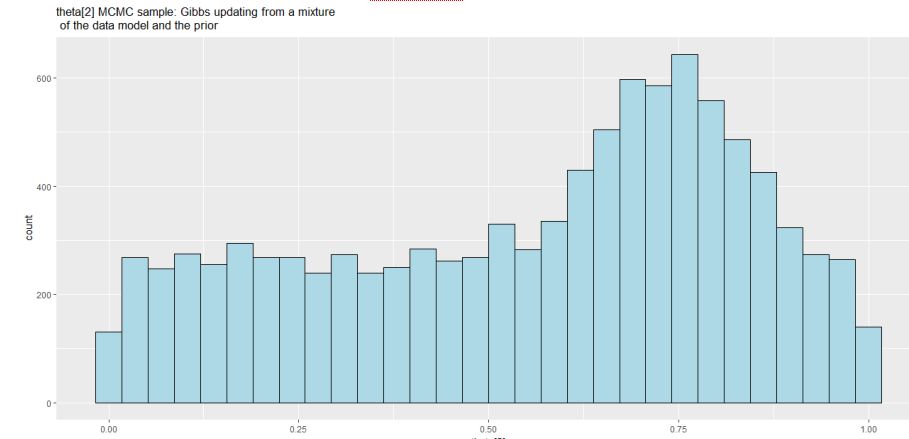
iv. Now explain the plot in d) from the above.
v. Which plot (dark or light) blue would likely represent the true underlying posterior of theta[2]
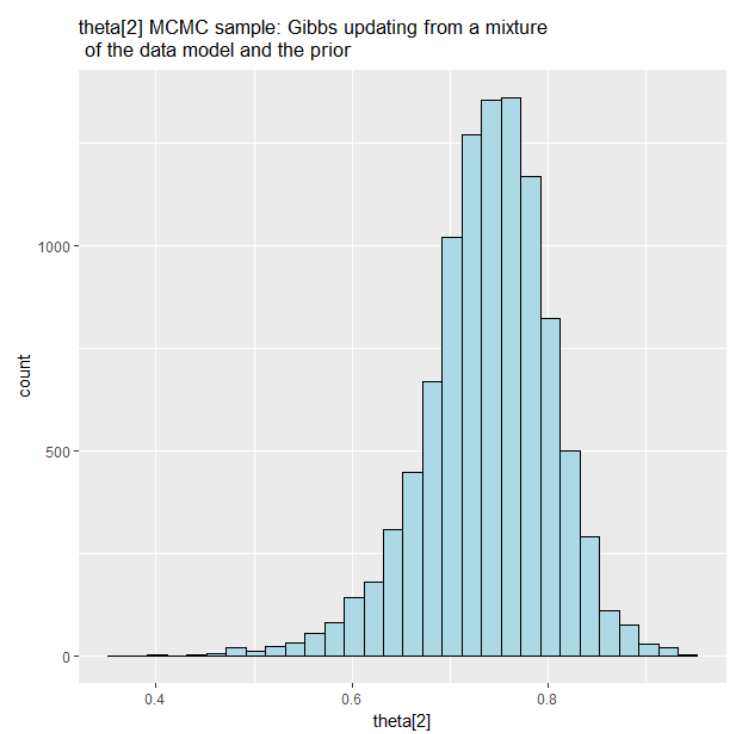
vi. Now create the following plot which represents the incorrect posterior of theta[2] using ggplot – make sure your name is on it.

vii. Explain the above plot – why does it have the shape it has and then say why it cannot be a true representation of the posterior for theta[2]?
5. Now using the method of pseudo priors recode the model and create a function that will produce mcmc output that will be a better representation of the posterior of theta[2]. Hint: Use a beta pseudo prior for theta[2], the shapes can be calculated using eq. 6.7 pg. 131.
a. Derive the formulae (eq. 6.7) given on pg. 131.
b. You will need to “post-process” the MCMC in order to obtain parameter estimates for the pseudo-prior.
i. Write a function that will create a list of the hyper-parameter estimates using the summary stats from a previous run of the MCMC sampler. Put into the rmd document.
ii. Give the output of the function for a previous MCMC run of the model (without pseudo priors)
iii. What part of the MCMC chain did you use (look at the picture below)?
c. Copy and paste your new pseudo prior JAGS model (not all the script JUST the model as in qu 3)
d. Make a function pseudobin() that will run the script – the function should produce
i. a ggplot of the posterior sample of theta[2]with fill = biased, make sure your name is on the title (ggtitle())
ii. a ggplot of the posterior sample of theta[2] – make sure your name is on the title.
iii. a bar plot of the “biased” parameter taken from the MCMC sample using ggplot.
iv. A command-line summary of the MCMC sample for the two parameters.
e. Looking at the above plot and the model used to make it – why are there more counts in the first facet than the second?

i. command-line summary output of all nodes – make it appear as a kable() – see knitr package.
代写CS&Finance|建模|代码|系统|报告|考试
编程类:C++,JAVA ,数据库,WEB,Linux,Nodejs,JSP,Html,Prolog,Python,Haskell,hadoop算法,系统 机器学习
金融类:统计,计量,风险投资,金融工程,R语言,Python语言,Matlab,建立模型,数据分析,数据处理
服务类:Lab/Assignment/Project/Course/Qzui/Midterm/Final/Exam/Test帮助代写代考辅导
E-mail:[email protected] 微信:BadGeniuscs 工作时间:无休息工作日-早上8点到凌晨3点
如果您用的手机请先保存二维码到手机里面,识别图中二维码。如果用电脑,直接掏出手机果断扫描。

