Lab 2: Drawing and Interpreting Graphs
物理世界代写 In this lab you will draw and interpret graphs. Materials:Ruler Graph paper or the grid paper sheet included in the lab 2 folder
In this lab you will draw and interpret graphs.
Materials:
- Ruler
- Graph paper or the grid paper sheet included in the lab 2 folder
Part 1: Drawing a graph using graph paper
During a science lab, students had to find the speed of a moving cart. Using a motion detector, they were able to measure the position of the cart during some time interval. Their results are shown below.
Table 1:
| Time (s) | Position (cm) |
| 0 | 0 |
| 0.5 | 6 |
| 1 | 12 |
| 1.5 | 18 |
| 2 | 24 |
| 2.5 | 30 |
| 3 | 36 |
| 3.5 | 42 |
| 4 | 48 |
| 4.5 | 54 |
| 5 | 60 |
1.On the graph paper or attached grid paper, show a graphical representation of the results included in Table 1.
Before you start, determine the independent and dependent variable.
When you draw the graph:
a)use appropriate scale for each axis (use most of the sheet of graph paper, so the graph can be visible and easily interpreted),
b)include an appropriate title of the graph at the top of the page,
c)label each axis with the correct quantity or symbol, and correct unit,
d)plot each data point as an X or dot,
e)if your data points show a linear trend, draw the straight line which will connect all points
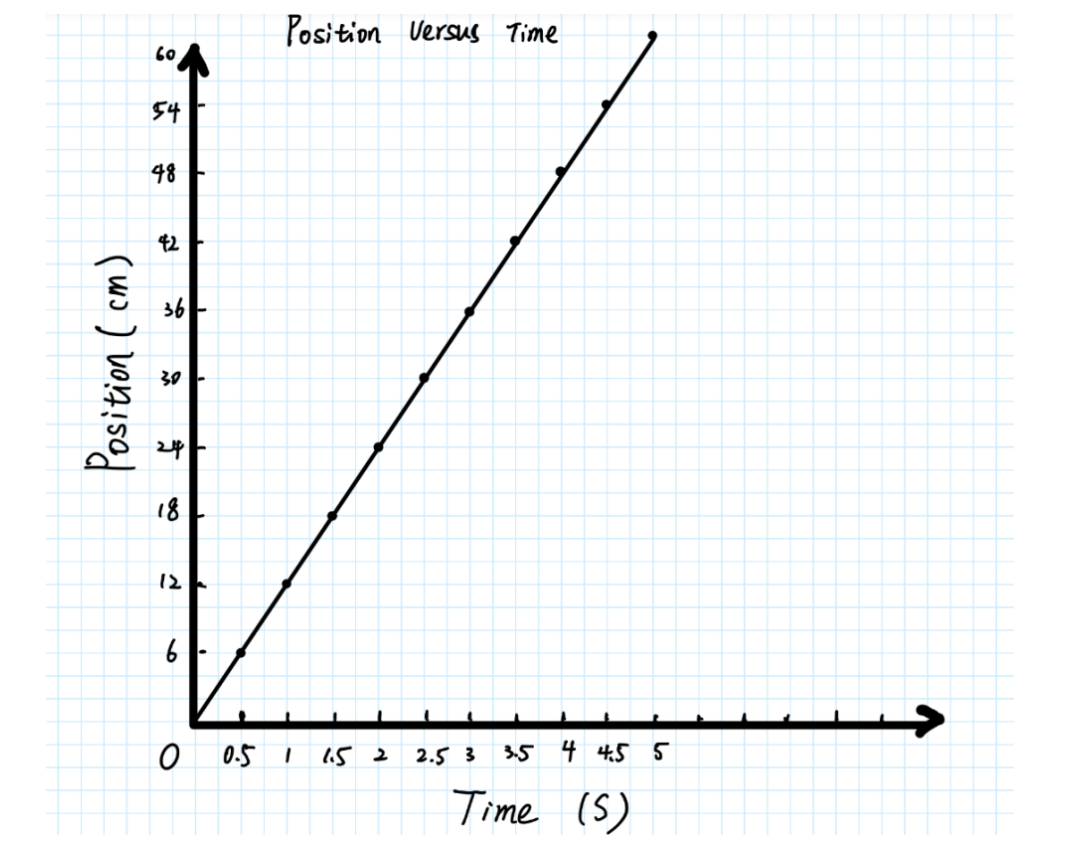
2.Based on the graph, briefly describe the relationship between the position of the cart and time. Use terms: direct, inverse/indirect, linear or quadratic relationship.
The position is direct relationship to the time.
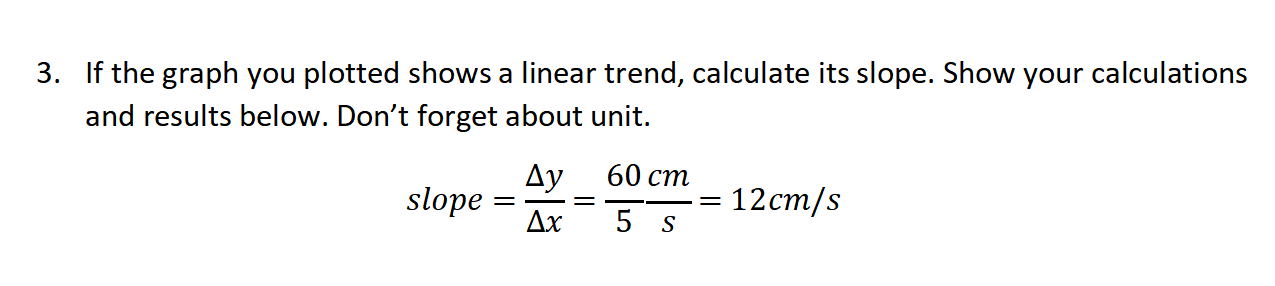
4.What does the slope represent? In other word, what physical quantity is described by the slope?
The slope at a point means the instantaneous velocity.
Part 2: Drawing a graph using graphing software. 物理世界代写
John decided to check how fast the temperature of hot tea changes if he adds one cube of ice. Table 2 includes measurements of temperature done during the first minute.
Table 2
| Time (s) | Temperature (ᵒC) |
| 0 | 95 |
| 5 | 80 |
| 10 | 75 |
| 15 | 69 |
| 20 | 62 |
| 25 | 59 |
| 30 | 58 |
| 35 | 55 |
| 40 | 52 |
| 45 | 50 |
| 50 | 48 |
| 55 | 42 |
| 60 | 40 |
1.Plot the scatter graph using Google Sheets, Excel or any other graphing software that you are familiar with. Remember to add all the required elements to plot the correct graph. For the chart type, please use a scatter chart/graph. Don’t forget to add the trend line in the last step.
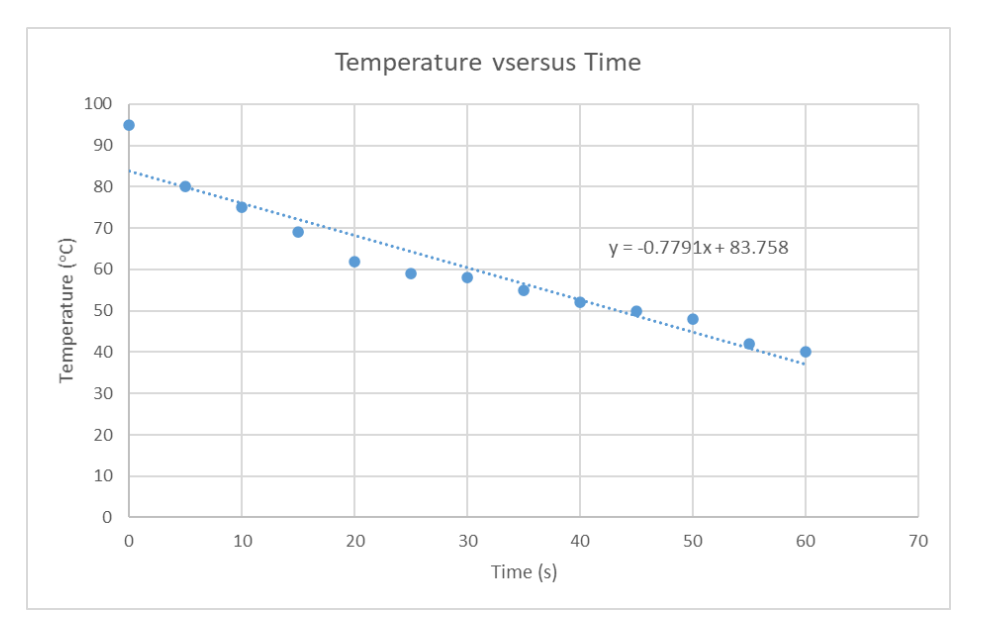
2.Based on the graph, briefly describe how the temperature of the tea changes with time. Use terms: positive, negative or no trend.
The temperature is negatively changing with time.
Part 3: Interpretation of graphs (1-6) 物理世界代写
Answer the questions located under each graph. If have to give numerical answer, don’t forget about unit. Points will be deducted if units are not included.
(Note: on all graphs, x (m) represents position)
1.
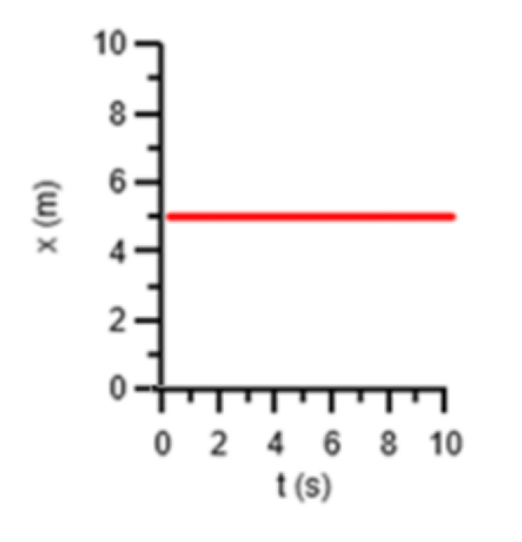
a)What is the position at t = 0 s?
b)What is the position at t = 5 s?
c)What is the velocity at t = 5 s?
2.
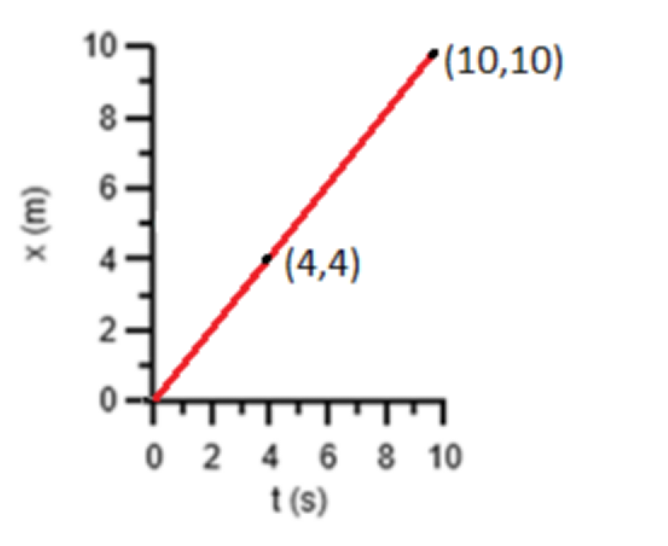
a)What is the position at t = 0 s?
b)What is the position at t = 5 s?
c)What is the velocity of the moving object? (Hint: velocity is a slope of position versus time graph)
3.
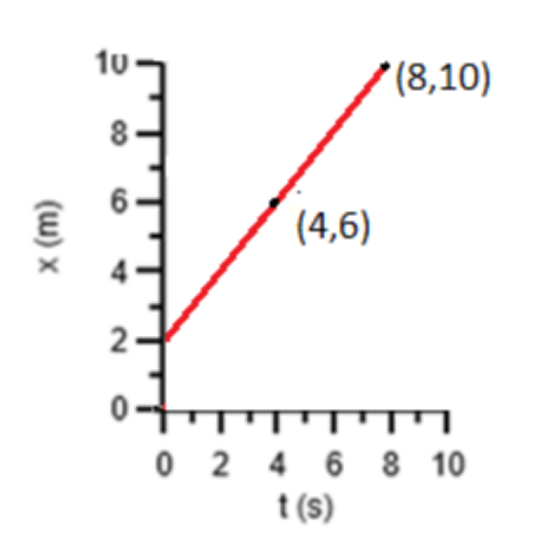
a)What is the position at t = 0 s?
b)What is the velocity of the moving object?
c)Is the velocity constant?
The slope does not change. So the velocity is constant.
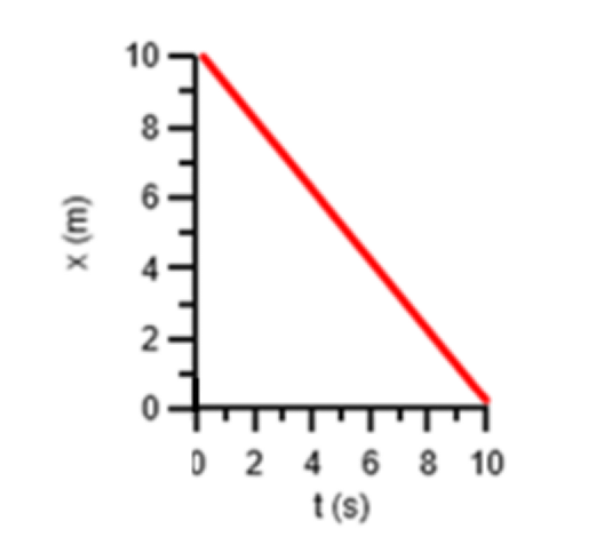
4.

Describe the relationship between position and time plotted on graph 4. Position is negatively linear to the time.
What is the velocity of the moving object?
5.
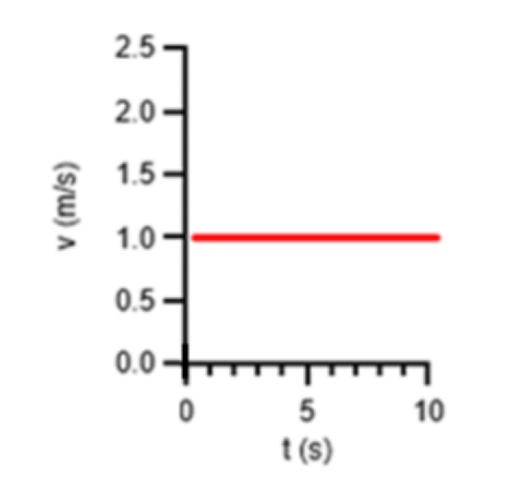
a)Which of the previous 1 – 4 position versus time graphs would correspond to the velocity versus time plot shown on above? Explain why.
The velocity remains 1 for all time. Previous 2 and 3 graphs correspond to this one.
6.
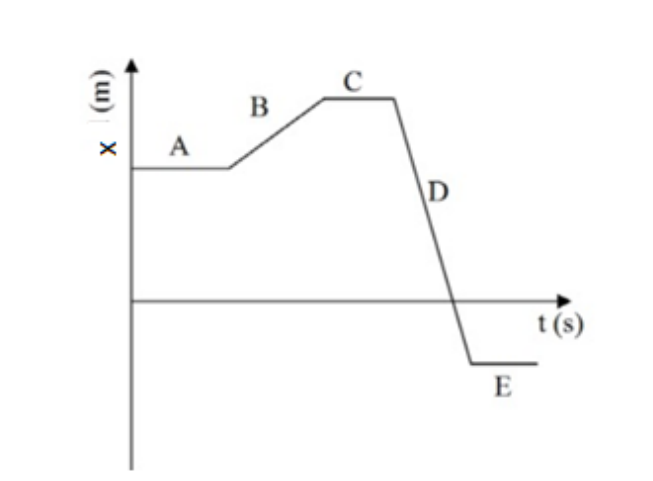
a)At what region: A, B, C, D or E is the magnitude of the velocity the greatest? D. Because the magnitude of slope of D is the largest. It is the steepest line.
b)At what region/regions is the velocity equal to 0 m/s? A and C. The slopes of A and C are zero. Thus the velocity is 0 m/s.
c)Is there any part of the graph for which the velocity is negative?
The velocity of D is negative. Because the slope of D is negative, this means the instantaneous velocity at D is negative.

更多代写:c/c++程序代写 考试枪手 英国Chemistry网课作业代做 cs论文essay代写 dissertation proposal写作代写 个人简历英文代写
