Risk modeling Final projects
- The volatility of stock can be calculated by calculating the standard deviation of stock return, i.e. STD (stock_ret); the beta of stock can be calculated by CAPM formula, where risk_free rate is 0.001.
volatility = std(data.stk_ret)=0.019
volatility_index = std(data.index_ret) = 0.0066
Through regression, we deduct the exponential return X of the risk-free interest rate and the stock return Y of the risk-free return, i.e. index_ret1 and stk_ret1 in the table. the formular is
The coefficient of the regression independent variable is 1.327。
Here we get a beta of 1.32, which is

obviously greater than 1, which means that the fluctuation of stock is greater than that of SP500. We get the fluctuation rate of SP500 is 0.0066, and the fluctuation rate of stock is 0.019, which further verifies that the fluctuation of stock is greater than that of SP500.
1.2
The price-earnings ratio of SP500 is about 19 times in 2017-2018, while that of AAL is about 13 times. Compared with the lower price-earnings ratio of the market, it can be considered as a value stock.
1.3
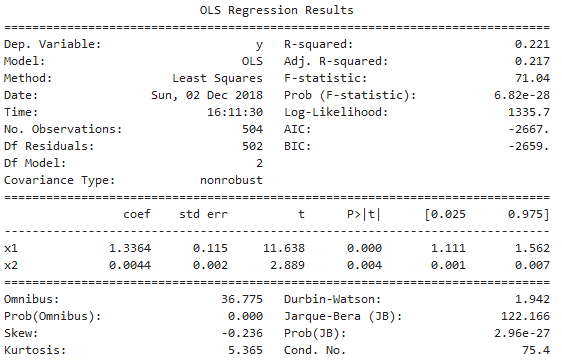
Calculate beta of HML with CAMP formula. The dependent variables are market rate of return and HML factor. The formula is


It can be seen that the beta value of HML is 0.0044 and the corresponding p value is 0.004. It can be considered that the beta value is significantly different from 0 at 5% confidence level.
1.4
The conclusion of 1.2 is that AAL is a value stock, i.e. the value is underestimated, so it will be exposed in theory on the P/E factor. The result of 1.3 indicates that the exposure of AAL on the P/E factor is 0.0044, and obviously not 0, which is consistent with the result of 1.2.
1.5
When buying the stock, short the SP500 share of the corresponding part at the same time, thereby reducing the beta of the stock and index portfolio and making the beta meet expectations.
2.
Using the closing price data of AAL, UAL, ALK, LUV from 20160801 to 20180801 and the annual report data of 2017, we can get the closing price data of 20180801 as follows:
AAL close 39.540000915527344
UAL close 80.4000015258789
ALK close 62.83000183105469
LUV close 58.15999984741211
The formular of EBITDA is
EBITDA = Total Operating Revenue – Operating Cost – Total Operating Cost
From the Annual Report of 2017 we can get
AAL’s total operating income is 3693300, operating cost is 850500, total operating expenses is 1499500, EBITDA = 1343300, circulating shares are 46058.15, long-term debt = 2251100.
UAL’s total operating income is 3343900, operating cost is 1386200, total operating expenses are 1319400, EBITDA = 638300, circulating shares are 27246.44, long-term debt = 1170300.
ALK’s total operating income is 693200, operating cost is 259000, total operating expenses are 278800, EBITDA = 155400, circulating shares are 12329.99 , long-term debt = 226200
LUV’s total operating income is 1931400, operating cost is 643100, total operating expenses are 853700, EBITDA = 434600, circulating shares are 56230.66, long-term debt = 332000.
AAL 20180801 closed at 39.54
UAL 20180801 closes at 80.4
ALK 20180801 closed at 62.83
LUV 20180801 closed at 58.16
AAL’s Enterprise Value/EBITDA = (39.54 mul 46058.15+2251100) / 1343300 = 3.03
UAL’s Enterprise Value / EBITDA = (80.4 mul 27246.44 + 1170300) / 638300 =5.27
ALK’s Enterprise Value/EBITDA = (62.83 mul 12329.99+226200) / 155400 = 6.44
LUV’s Enterprise Value/EBITDA = (58.16 mul 56230.66+332000)/ 434600 = 8.29
2.2
AAL and UAL are both in the aviation industry and have similar business. From the Enterprise Value/EBITDA calculated above, we can find that AAL and UAL are close to Enterprise Value/EBITDA, which indicates that the valuation of the net market ratio of the two companies is similar, that is, the market underestimates the two companies at the same level. so UAL is the most appropriate comparable firm to UAL
2.3
The implied Enterprise Value of AAL can be caculated as follows
5.27*1343300-2251100 = 4828090
The implied share price of AAL can be caculated as follows
(5.27*1343300-2251100)/46058.15 = 104
2.4
We choose UAL company to estimate the company value of AAL company because of the EV/EBITDA value among the three competitors selected, UAL and AAL are the most similar, but in fact the valuation of the two companies is double the difference, so the calculated market value of AAL company is different.
3
The optimal position can be caculated as followd formular
3.3
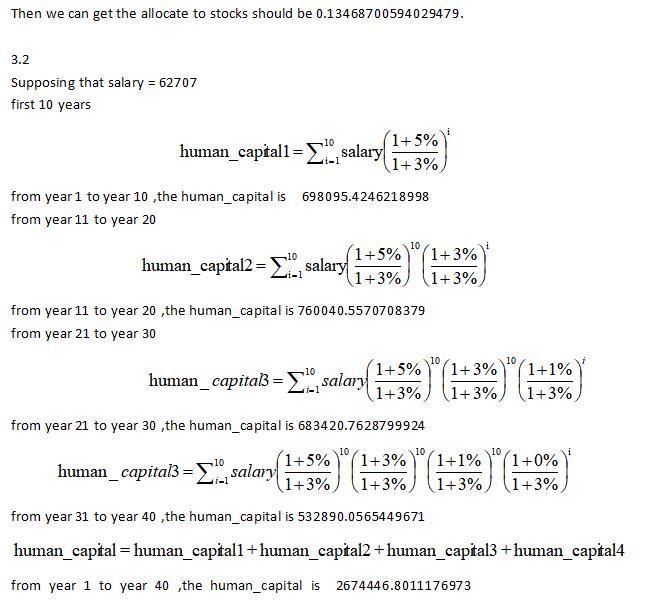
Stock_money = (62707+10000)*y
stock_weight = stock_money /10000
the money allocate to stocks should be 9792.688140901013
so the weight of $10,000 allocated to stocks should be , 0.9792688140901012
3.4
The formular can be
human_capital = human_capital2+human_capital3+human_capital4
from year 11 to year 40 ,the human_capital is 1976351.3764957972
3.5
after 20 years ,the salery can be 137271.7788930041
Stock_money = (salary1+50000)*y
stock_weight = stock_money /50000
the money allocate to stocks should be 25223.075196211616
so the weight of $50,000 allocated to stocks should be , 0.5044615039242323
4.1
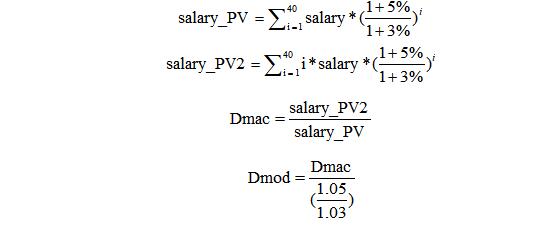
suppose growth rates of your wages is 5%
the modified duration is 22.598828552906667
4.2
Assuming that the rate of annual wage growth remains unchanged, but the risk-free interest rate is constantly changing, in order to ensure the value of that investment does not go up or go down with the value of your human capital as interest rate changes, interest rate futures or interest rate options can be purchased so that the interest rate can be agreed at the beginning of the term, thus ensuring that the investment does not go up or go down with the value of your human capital as interest rate changes. Guarantee the stability of the value of the whole portfolio .
5
5.1
In terms of revenue passenger miles, the market share of the four major US Airlines reached 66% in 2016, resulting in the formation of an oligopoly in the US aviation industry. JetBlue, the fifth largest airline, has a market share of only 6.5%, which is not a threat to the four major airlines at all. In addition to the superficial oligopoly characteristics, the shareholders behind the four major airlines also have a high degree of overlap, which makes the monopoly characteristics of the American civil aviation industry more serious. We can see that there are four institutions, and the total share of the four major U.S. Airlines is more than 20%. The high overlap of shareholders makes the competition among the four major airlines weaker. Reflecting on the stock price, we can see that AAL’s stock price has not risen sharply relative to SP500 in the past two years, because on the one hand, the company has entered a mature period, on the other hand, the growth of SP500 in the past two years indicates that the index component stocks are still in the growth stage. So the beta change of AAL is bigger than that of index. At this point, if we want to avoid excessive beta, we can short some of the index hedging unnecessary beta.


